
 Data Structure
 Networking
 RDBMS
RDBMS Operating System
 Java
Java MS Excel
 iOS
iOS HTML
HTML CSS
CSS Android
 Python
 C Programming
 C++
C++ C#
C# MongoDB
 MySQL
MySQL Javascript
 PHP
PHP
- Selected Reading
- UPSC IAS Exams Notes
- Developer's Best Practices
- Questions and Answers
- Effective Resume Writing
- HR Interview Questions
- Computer Glossary
- Who is Who
Plotting with seaborn using the matplotlib object-oriented interface
Seaborn is used to visualizing the random distribution and we can use matplotlib interface to show this distribution over a diagram.
We can take the following steps to show the diagram −
Figure level interface for drawing distribution plots onto a Face Grid. This function provides access to several approaches for visualizing the univariate or bivariate distribution of data, including subsets of data defined by semantic mapping and faceting across multiple subplots.
List of numbers can be passed in the above-defined method, i.e., displot().
To show the diagram, plt.show() can be used whereas plot was drawn using Seaborn.
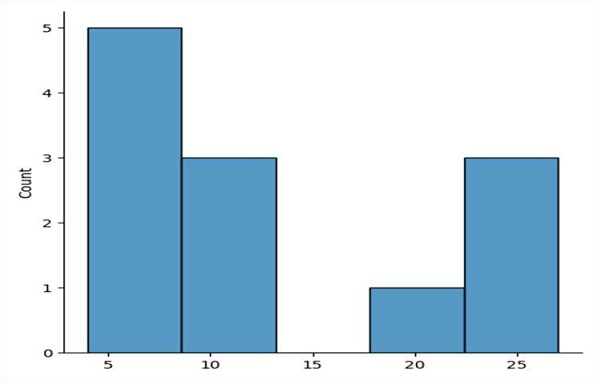
Example
import matplotlib.pyplot as plt
import seaborn as sns

sns.displot([4, 5, 6, 7, 8, 9, 10, 11, 21, 23, 25, 27])

plt.show()
Output

Updated on: 2021-03-15T07:46:37+05:30
326 Views

Advertisements