
Article Categories
- All Categories
-
 Data Structure
-
 Networking
-
 RDBMS
RDBMS
-
 Operating System
-
 Java
Java
-
 MS Excel
-
 iOS
iOS
-
 HTML
HTML
-
 CSS
CSS
-
 Android
-
 Python
-
 C Programming
-
 C++
C++
-
 C#
C#
-
 MongoDB
-
 MySQL
MySQL
-
 Javascript
-
 PHP
PHP
-
 Economics & Finance
Selected Reading
How to align multiple plots in a grid using GridSpec Class in Matplotlib
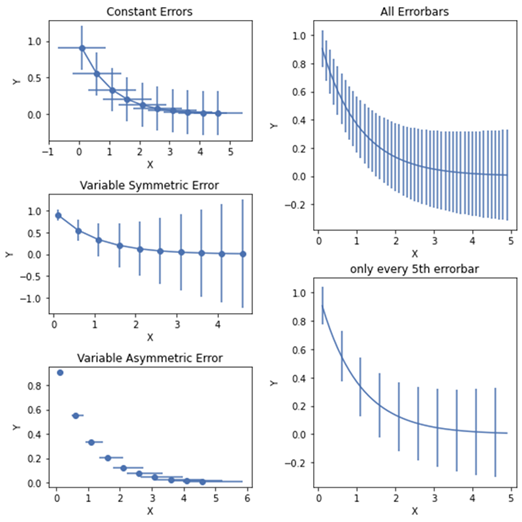
Aligning the multiple plots in a grid can be very messy and it can create multiple issues like higher width and height or minimal width to align all the plots. In order to align all the plots in a grid, we use GridSpec class.
Let us suppose that we have a bar graph plot and we want to align the symmetry of the plot in this sample.
First Import all the necessary libraries and plot some graphs in two grids. Then, we will plot a constant error bar and a symmetric and asymmetric error bar on the first grid. In the second grid, we will plot the sample error bar.
Example
import matplotlib.pyplot as plt
from matplotlib.gridspec import GridSpec

#Define the figure size and layout
fig = plt.figure(figsize=(8,8))
plt.style.use('seaborn-deep')

#Define the function to plot the graph
def plot_errorbar(axs, x, y, xerr=None, yerr=None, errevery=1,
   title=None, xlabel=None, ylabel=None, fmt=None):
      ax = fig.add_subplot(axs)
ax.errorbar(x, y, xerr=xerr, yerr=yerr, errorevery=errevery, fmt=fmt)
ax.set(title=title, xlabel=xlabel, ylabel=ylabel)

#First grid with size (3,1)
gs1 = GridSpec(3, 1)

#Data for exponential curve
x = np.arange(0.1, 5, 0.5)
y = np.exp(-x)

#Plot the errorbar with constant axis x and y
plot_errorbar(gs1[0], x, y, xerr=0.8, yerr=0.3, title='Constant
   Errors', xlabel='X', ylabel='Y', fmt='-o')
#Define the varying error with as a function of x
error = 0.1 + 0.25 * x
plot_errorbar(gs1[1], x, y, yerr=error, title='Variable Symmetric
   Error', xlabel='X', ylabel='Y', fmt='-o')

#Define the bounded and unbounded error
lower_error = 0.5 * error
upper_error = error
asymmetric_error = [lower_error, upper_error]
plot_errorbar(gs1[2], x, y, xerr=asymmetric_error, title='Variable
   Asymmetric Error', xlabel='X', ylabel='Y', fmt='o')

#Plot the Grid 2 with the same step as in Grid 1
gs1.tight_layout(fig, rect=[0, 0, 0.5, 1])

#Define the data with a smaller interval for exponential curve
x = np.arange(0.1, 5, 0.1)
y = np.exp(-x)
gs2 = GridSpec(2, 1)
'yerr = 0.1 + 0.1 * np.sqrt(x)
plot_errorbar(gs2[0], x, y, yerr=yerr, title='All Errorbars', xlabel='X', ylabel='Y', fmt='-')
plot_errorbar(gs2[1], x, y, yerr=yerr, errevery=5, title='5th errorbar', xlabel='X', ylabel='Y', fmt='-')
gs2.tight_layout(fig, rect=[0.5, 0, 1, 1], h_pad=0.5)
top = min(gs1.top, gs2.top)
bottom = max(gs1.bottom, gs2.bottom)
gs1.update(top=top, bottom=bottom)
gs2.update(top=top, bottom=bottom)

#Display the plot
plt.show()
Output

Updated on: 2021-02-23T18:22:08+05:30
1K+ Views

Advertisements