 Data Structure
 Networking
 RDBMS
RDBMS Operating System
 Java
Java MS Excel
 iOS
iOS HTML
HTML CSS
CSS Android
 Python
 C Programming
 C++
C++ C#
C# MongoDB
 MySQL
MySQL Javascript
 PHP
PHP
- Selected Reading
- UPSC IAS Exams Notes
- Developer's Best Practices
- Questions and Answers
- Effective Resume Writing
- HR Interview Questions
- Computer Glossary
- Who is Who
Network Analysis in Python
A network is a collection of nodes and edges that represent the relationships or connections between those nodes. The nodes can represent various entities, such as individuals, organizations, genes, or websites, while the edges represent the connections or interactions between them.
Network analysis is the study of the relationships between these entities are node represented as a network. In this article, we are going to see how to implement network analysis using python. It involves the use of many mathematical, statistical and computational techniques. Network analysis can provide insights into the behaviour of complex systems and help to make informed decisions in various domains.
Python offers us a package called networkx which is of great help for creation, manipulation, and analysis of complex networks. Before going forward with the article, we shall install networkx for network analysis in python using the following command in the terminal:
pip install networkx
Creating a Simple Graph
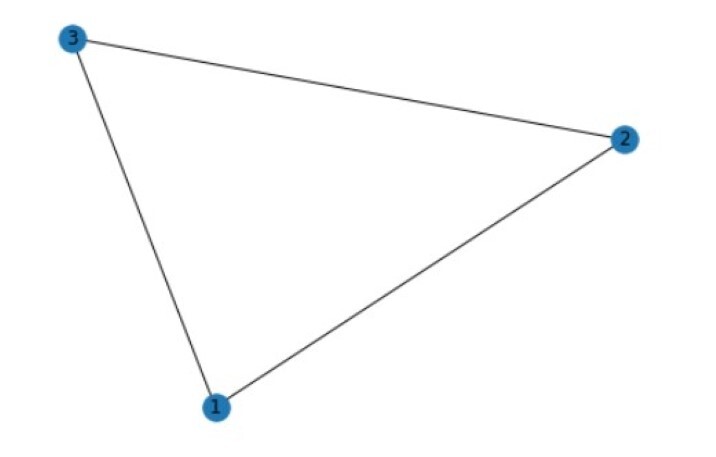
Here we shall be creating a simple graph using the networkx library. It would consist of 3 nodes and 3 edges. We will then calculate the degree and clustering coefficient of each node and finally draw the graph.
Degree of a node: The number of neighbours a node has in the graph. It can be calculated by counting the number of edges connected to the node.
clustering coefficient: A measure of the degree to which the neighbours of the node are connected to each other. In another words it is a measure of the density of the local connections in the graph around a particular node. It is calculated by dividing the number of edges that exist between the neighbours of the node by the maximum possible number of such edges.
Example
import networkx as nx
import matplotlib.pyplot as plt
# create an empty graph
GÂ =Â nx.Graph()
# add nodes
G.add_node(1)
G.add_node(2)
G.add_node(3)
# add edges
G.add_edge(1, 2)
G.add_edge(2, 3)
G.add_edge(3, 1)
print("Node degree:")
for node in G.nodes():
   print(f"{node}: {G.degree(node)}")
# clustering coefficient
print("Node clustering coefficient:")
for node in G.nodes():
   print(f"{node}: {nx.clustering(G, node)}")
# draw the graph
nx.draw(G, with_labels=True)
plt.show()
Output
Node degree:
1: 2
2: 2
3: 2
Node clustering coefficient:
1: 1.0
2: 1.0
3: 1.0

Identifying Communities
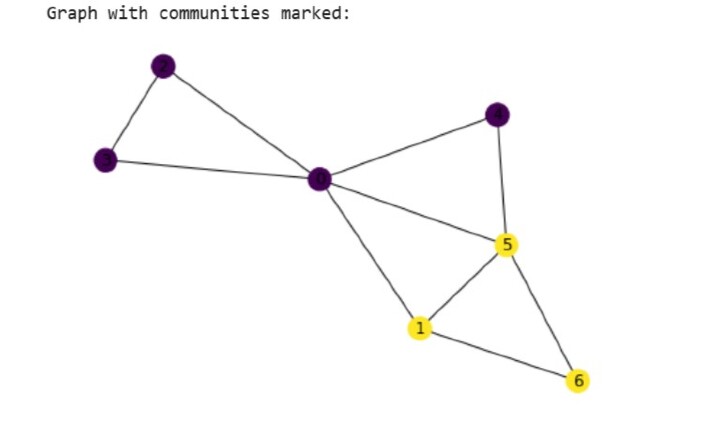
Identifying communities in a graph is the process of partitioning the nodes of the graph into groups or clusters based upon similar characteristics. In order to do so, the Louvain algorithm is used. It is an iterative algorithm and works by optimizing a quality function that measures the modularity of the given community structure. Modularity measures the degree to which the number of edges within community is higher as compared to the expected number of edges in a random graph.
The Louvain algorithm works in two phases which are:
The algorithm assigns each node to its own community. Then iteratively moves the nodes between the communities so that it can increase the modularity. This process is continuously repeated till there is no room left for improvement of modularity.
The algorithm then constructs new graph reach node represents a community from the first phase. The edges represent the total weight of the edges between the communities. Lastly the 1st phase is applied to this new graph to help identify the communities at a coarser level of granularity.
Louvain algorithm is highly efficient and useful for the detection of communities in large graphs with millions of nodes and edges.
Example
import networkx as nx
import matplotlib.pyplot as plt
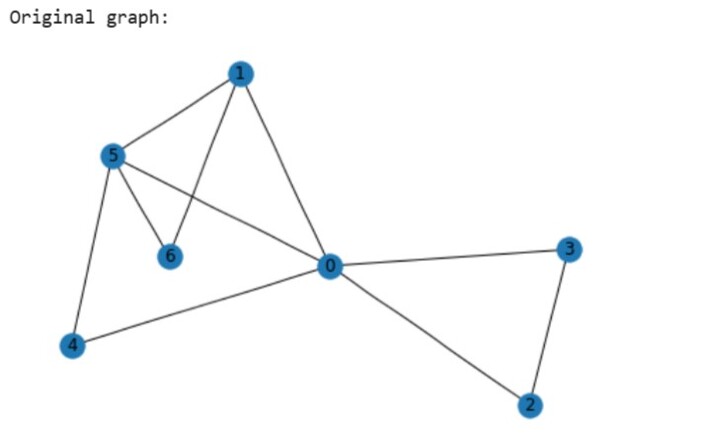
GÂ =Â nx.gnm_random_graph(7,10)
# draw the graph
print("Original graph:")
nx.draw(G,with_labels=True)
plt.show()
print("Node degree:")
for node in G.nodes():
   print(f"{node}: {G.degree(node)}")
print("Node betweenness centrality:")
bc = nx.betweenness_centrality(G)
for node in bc:
   print(f"{node}: {bc[node]}")
# community identification using Louvain algorithm
communities = nx.algorithms.community.modularity_max.greedy_modularity_communities(G)
# print the communities and the number of nodes in each community
i = 1
for c in communities:
   print(f"Community {i}: {c}")
   i += 1
   print(f"Number of nodes: {len(c)}")
color_map = []
for node in G.nodes():
   for i in range(len(communities)):
      if node in communities[i]:
         color_map.append(i)
print("Graph with communities marked:")
nx.draw(G, node_color=color_map, with_labels=True)
plt.show()
Output

Node degree:
0: 5
1: 3
2: 2
3: 2
4: 2
5: 4
6: 2
Node betweenness centrality:
0: 0.5666666666666667
1: 0.1
2: 0.0
3: 0.0
4: 0.0
5: 0.2
6: 0.0
Community 1: frozenset({0, 2, 3, 4})
Number of nodes: 4
Community 2: frozenset({1, 5, 6})
Number of nodes: 3

Analysing Homophily
Homophily is the tendency of individuals to associate with other individuals who posses similar characteristics or trains to themselves like beliefs, values or demographics like age, gender, race etc.
It is a well-documented social phenomenon and is helpful in analysing network.
We will be studying the role of homophily to shape the structure of a network including the tendency of similar nodes to be connected to each other.
The homophily coefficient for a graph which measures this tendency of similar nodes to be connected is calculated with the help of the nx.attribute_assortativity_coefficient() function and ranges from 1 to 1. A positive value indicates more likeliness while negative indicates a lesser likelihood.
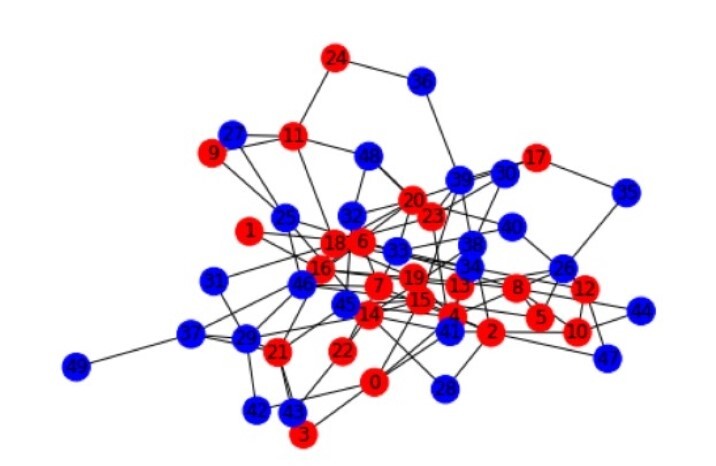
In the code below we not only calculate the homophily coefficient but also mark the nodes by assigning them a binary attribute "type" to each node to indicate whether it belongs to group A or group B. We have also drawn the graph with nodes coloured by their type to visualize any patterns of homophily.
Example
import networkx as nx
import matplotlib.pyplot as plt
G = nx.gnm_random_graph(50, 100)
#Â binary attributes for each node for indication of it's type
for node in G.nodes():
   G.nodes[node]['type'] = 'A' if node < 25 else 'B'
# draw the graph and colour the nodes with their corresponding types A or B
color_map = ['red' if G.nodes[node]['type'] == 'A' else 'blue' for node in G.nodes()]
nx.draw(G, node_color=color_map, with_labels=True)
plt.show()
homophily_coeff = nx.attribute_assortativity_coefficient(G, 'type')
print(f"Homophily coefficient: {homophily_coeff}")
Output

Homophily coefficient: -0.0843989769820972
Conclusion
Network analysis is of great use for studying the structure and dynamics of complex systems including social networks. Python offers a variety of libraries to do so, however networkx is the most commonly used one. With network analysis in python researchers and analysts can answer a variety of research questions like identifying key nodes and communities, measuring the robustness and resilience of networks, detecting patterns of homophily and social influence. While network analysis can a complex technical field, with careful attention to data preparation and cleaning it can help in addressing a large number of real world problems as well as help business in their growth.
