 Data Structure
 Networking
 RDBMS
RDBMS Operating System
 Java
Java MS Excel
 iOS
iOS HTML
HTML CSS
CSS Android
 Python
 C Programming
 C++
C++ C#
C# MongoDB
 MySQL
MySQL Javascript
 PHP
PHP
- Selected Reading
- UPSC IAS Exams Notes
- Developer's Best Practices
- Questions and Answers
- Effective Resume Writing
- HR Interview Questions
- Computer Glossary
- Who is Who
Active product sales analysis using matplotlib in Python
Matplotlib in Python has various functions like read_csv,sort_values,group_by, etc to perform sales data analysis. Every online business which is involved in product sales of any type uses product sales data analysis to increase their sales and know their customers better. Any company which is involved in any type of e-commerce business uses its sales and customer data to identify trends, patterns, and insights that can be used to improve sales and revenue. The sales data can be used to determine which product has the highest traction, which festive season has the highest demand, and many other trends which can help to increase sales.
Python is a popular programming language for data analysis and visualization. Python provides many libraries and tools that can be used to do product sales analysis effectively. In this article, we will use Matplotlib, which is a popular data visualization library in Python to do active product sales analysis.
We will be using sample sales data for active product sales analysis using numpy, pandas and matplotlib. The sample sales data can be found here.
StepWise Sales Data Analysis
Data Reading and Processing
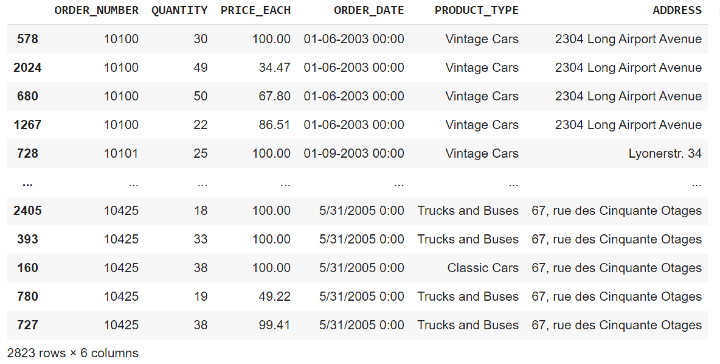
The sample sales data used in this example for analysis has the following columns ?
Order_Number |
Product_type |
Quantity |
Price_Each |
Order_Date |
Address |
Order Number ? Unique number for each placed order.
Product_Type ? Category of the product
Quantity ? quantity of the product ordered
Price Each ? Price per unit
Order Date ? Date and time when the order was placed
Address ? Address to which the product was delivered.
We will have to import pandas and numpy which can be used to read and process the sample sales data. Here is the code to read the data ?
The sample sales data can be found on the Kaggle platform here.
Example
import pandas as pd
import numpy as np
import io
from google.colab import files
uploaded = files.upload()

# read csv data
Sales_data = pd.read_csv(io.BytesIO(uploaded['sample_sales_data.csv']), encoding='cp1252')
Sales_data.sort_values(by=['ORDER_NUMBER'])
Output

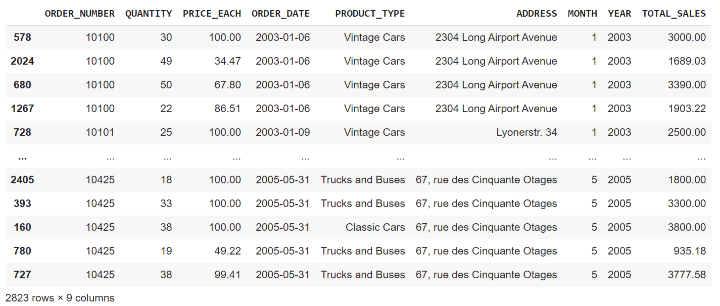
Once we have read the data, we have to do the processing of the data. The Order Date column needs to be converted to a DateTime object and we can extract month and year from the order date and add a new column for a month, year, and total sales. The code for data cleaning and processing is shown below ?
Example
Sales_data['ORDER_DATE'] = pd.to_datetime(Sales_data['ORDER_DATE'])
Sales_data['MONTH'] = Sales_data['ORDER_DATE'].dt.month
Sales_data['YEAR'] = Sales_data['ORDER_DATE'].dt.year
Sales_data['TOTAL_SALES'] = Sales_data['QUANTITY'] * Sales_data['PRICE_EACH']
Sales_data.sort_values(by=['ORDER_NUMBER'])
Output

The new column month, year, and toatal_sales will help us analyze the sales trend over time. Now we can use these columns to plot different plots using the matplotlib library to get some insights from the sample_sales_data.
Data Visualization
Till now we have read and processed our data to use it to plot different plots using the matplotlib library in Python. Matplotlib provides line, bar, and scatter plots to visualize the data.
Visualization of total sales over time
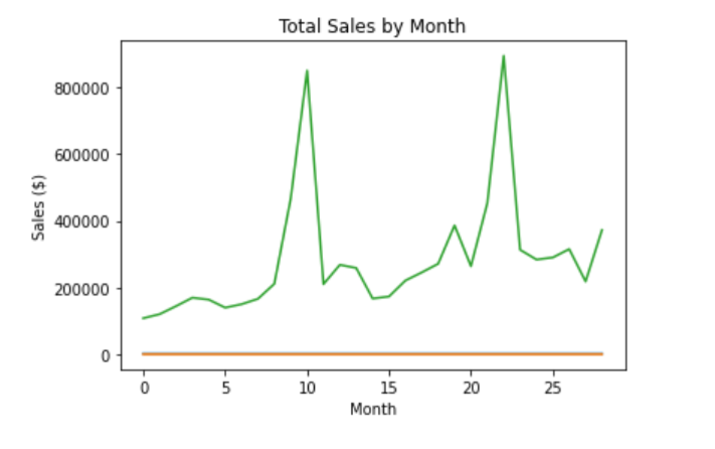
To visualize the total sales over time we can plot a line graph using matplotlib.To visualize that we have to ?
Group the data by year and month
Create a line chart using matplotlib
Set the title and axis labels
Display the chart
Example
import matplotlib.pyplot as plt

# Group the data by year and month
sales_by_month = Sales_data.groupby(['YEAR', 'MONTH']).sum()['TOTAL_SALES'].reset_index()

# Create a line chart
plt.plot(sales_by_month.index, sales_by_month.values)

# Set the title and axis labels
plt.title('Total Sales by Month')
plt.xlabel('Month')
plt.ylabel('Sales ($)')

# Display the chart
plt.show()
Output

Visualization of annual revenue over time
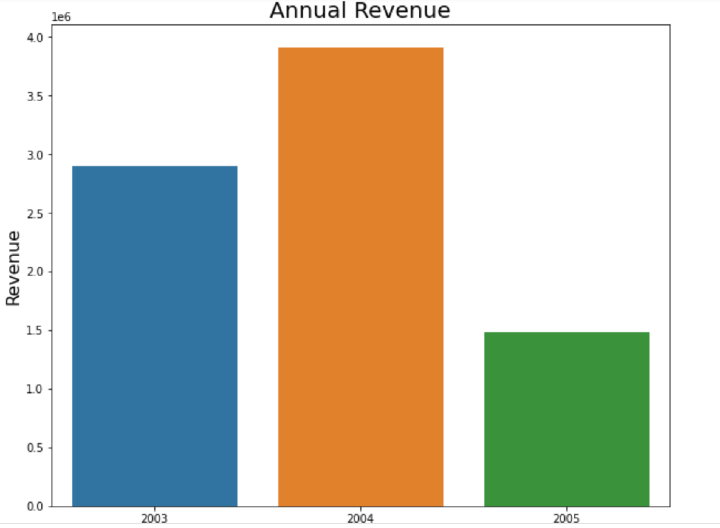
We can visualize the annual revenue for every year and can see which year has the highest revenue and which year has the lowest revenue till now. To do so we have to?
Group the sales data by year
Create a bar plot using Seaborn which uses matplotlib underneath
Set the title and axis labels
Display the chart
Example
import numpy as np
import pandas as pd
import matplotlib.pyplot as plt
import seaborn as sns

# Annual Revenue
plt.figure(figsize=(10,6))
yearly_revenue = Sales_data.groupby(['YEAR'])['TOTAL_SALES'].sum().reset_index()
sns.barplot(x="YEAR", y="TOTAL_SALES", data=yearly_revenue)

plt.title('Annual Revenue', fontsize = 20)
plt.xlabel('Year', fontsize = 16)
plt.ylabel('Revenue', fontsize = 16)

plt.show()
Output

Conclusion
We can analyze and visualize any type of product sales data using matplotlib in Python and get standard data insights that can be used by the company to increase sales. We analyzed the total sales over time and year-wise revenue in the above article using matplotlib, pandas, and numpy in Python.

