- LightGBM - Home
- LightGBM - Overview
- LightGBM - Architecture
- LightGBM - Installation
- LightGBM - Core Parameters
- LightGBM - Boosting Algorithms
- LightGBM - Tree Growth Strategy
- LightGBM - Dataset Structure
- LightGBM - Binary Classification
- LightGBM - Regression
- LightGBM - Ranking
- LightGBM - Implementation in Python
- LightGBM - Parameter Tuning
- LightGBM - Plotting Functionality
- LightGBM - Early Stopping Training
- LightGBM - Feature Interaction Constraints
- LightGBM vs Other Boosting Algorithms
- LightGBM Useful Resources
- LightGBM - Quick Guide
- LightGBM - Useful Resources
- LightGBM - Discussion
LightGBM - Plotting Functionality
LightGBM offers various tools for creating plots that help you visualize the performance of your models, feature importance, and more. So in this chapter we are writing some common plotting functions you can use with LightGBM.
LightGBM Plotting Functions
So here is a list of plotting functions commonly used in LightGBM −
plot_importance()
The plot_importance() method uses a booster object and then plot the feature importance. This method uses a parameter called importance_type which is used to set to string split and it will plot the number of times feature is used for splitting and plotting gains of splits when it is set to string gain. The value of the parameter importance_type is split.
The function has one more parameter called max_num_features and it accepts an integer which shows how many features we need to include in the plot. Also we can limit the number of features with the help of this parameter.
Syntax
Here is the syntax we can use for the plot_importance() function −
lightgbm.plot_importance(
   ax=None,
   booster,
   height=0.2,
   ylim=None,
   xlim=None,
   xlabel='Feature importance',
   title='Feature importance',
   importance_type='split',
   ylabel='Features',
   ignore_zero=True,
   max_num_features=None,
   grid=True,
   figsize=None,
   precision=3
)
Parameters
The parameters are needed to use the plot_importance() function are mentioned below −
booster − It is the trained LightGBM model.
importance_type − It is used to define how to calculate feature importance. It has two values split and gain. The default value is split.
max_num_features − Used to Limit the number of top features.
figsize − It is a tuple and used to show the size of the plot, for example (10, 6).
xlabel, ylabel − These are the labels for the x and y axes.
title − It defines the title for the plot.
ignore_zero − If it is set to True it basically ignores features with zero importance.
grid − If it is set to True so it displays the grid in the plot.
Example
Here is the example shown below to show you the usage of plot_importance() function −
import lightgbm as lgb
import matplotlib.pyplot as plt

# Assuming you have a trained model `gbm`
lgb.plot_importance(gbm, importance_type='gain', max_num_features=10, figsize=(10, 6))
plt.show()
Output
Here is the output of the above code −

plot_metric()
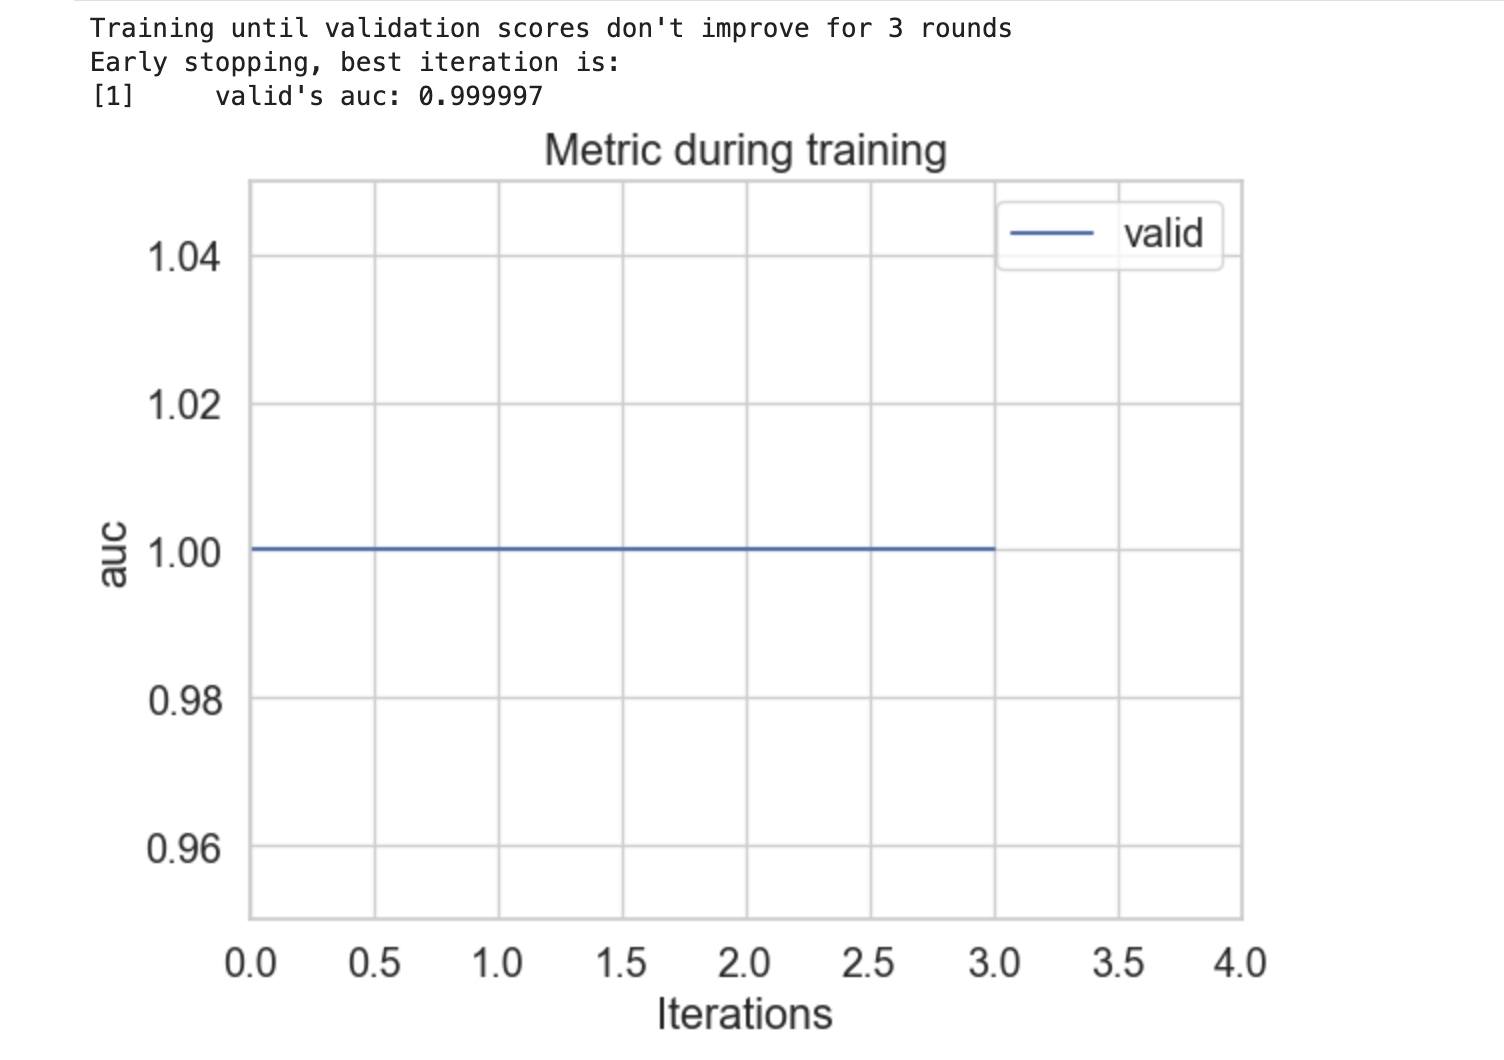
The plot_metric() function is used to plot the results of an evaluation metric. To use this function we have to give a booster object inside the method to plot an evaluation metric evaluated on the dataset.
Syntax
Below is the syntax we can use for the plot_metric() function −
lightgbm.plot_metric(
   eval_result,
   metric=None,
   dataset_names=None,
   ax=None,
   title='Metric during training',
   xlabel='Iterations',
   ylabel='Auto',
   figsize=None,
   grid=True
)
Parameters
Here are the parameters needed for the plot_metric() function −
eval_result − It is a dictionary which is returned by the train() method. It basically contains the evaluation results.
metric − It is the evaluation metric that you want to plot. It is none so all metrics are plotted.
dataset_names − It is the list of dataset names to use in the plot.
ax − It is the Matplotlib axes object to plot. If it is set to None so a new plot is created.
title − It is the title of the plot.
xlabel − It is the label for the X-axis.
ylabel − It is the label for the Y-axis.
figsize − It is the tuple for the figure size.
grid − It is used to show a grid. Its default value is True.
Example
Here is the Python complete code which uses the model and shows the usage of plot_metric() function −
import lightgbm as lgb
import matplotlib.pyplot as plt
from sklearn.datasets import make_blobs
from sklearn.model_selection import train_test_split

# Generate sample binary classification data
X, y = make_blobs(n_samples=10_000, centers=2)

# Split the data
X_train, X_valid, y_train, y_valid = train_test_split(X, y, train_size=0.8)

# Prepare the dataset for LightGBM
dtrain = lgb.Dataset(X_train, label=y_train)
dvalid = lgb.Dataset(X_valid, label=y_valid)

# Dictionary to store results
evals_result = {}

# Train the model
model = lgb.train(
   params={
      "objective": "binary",
      "metric": "auc",
   },
   train_set=dtrain,
   valid_sets=[dvalid],
   valid_names=['valid'],
   num_boost_round=10,
   callbacks=[
      lgb.early_stopping(stopping_rounds=3),
      lgb.record_evaluation(evals_result)
   ]
)

# Plot the evaluation metric
lgb.plot_metric(evals_result, metric='auc')
plt.show()
Output
Following is the outcome of the mentioned code −
plot_split_value_histogram()
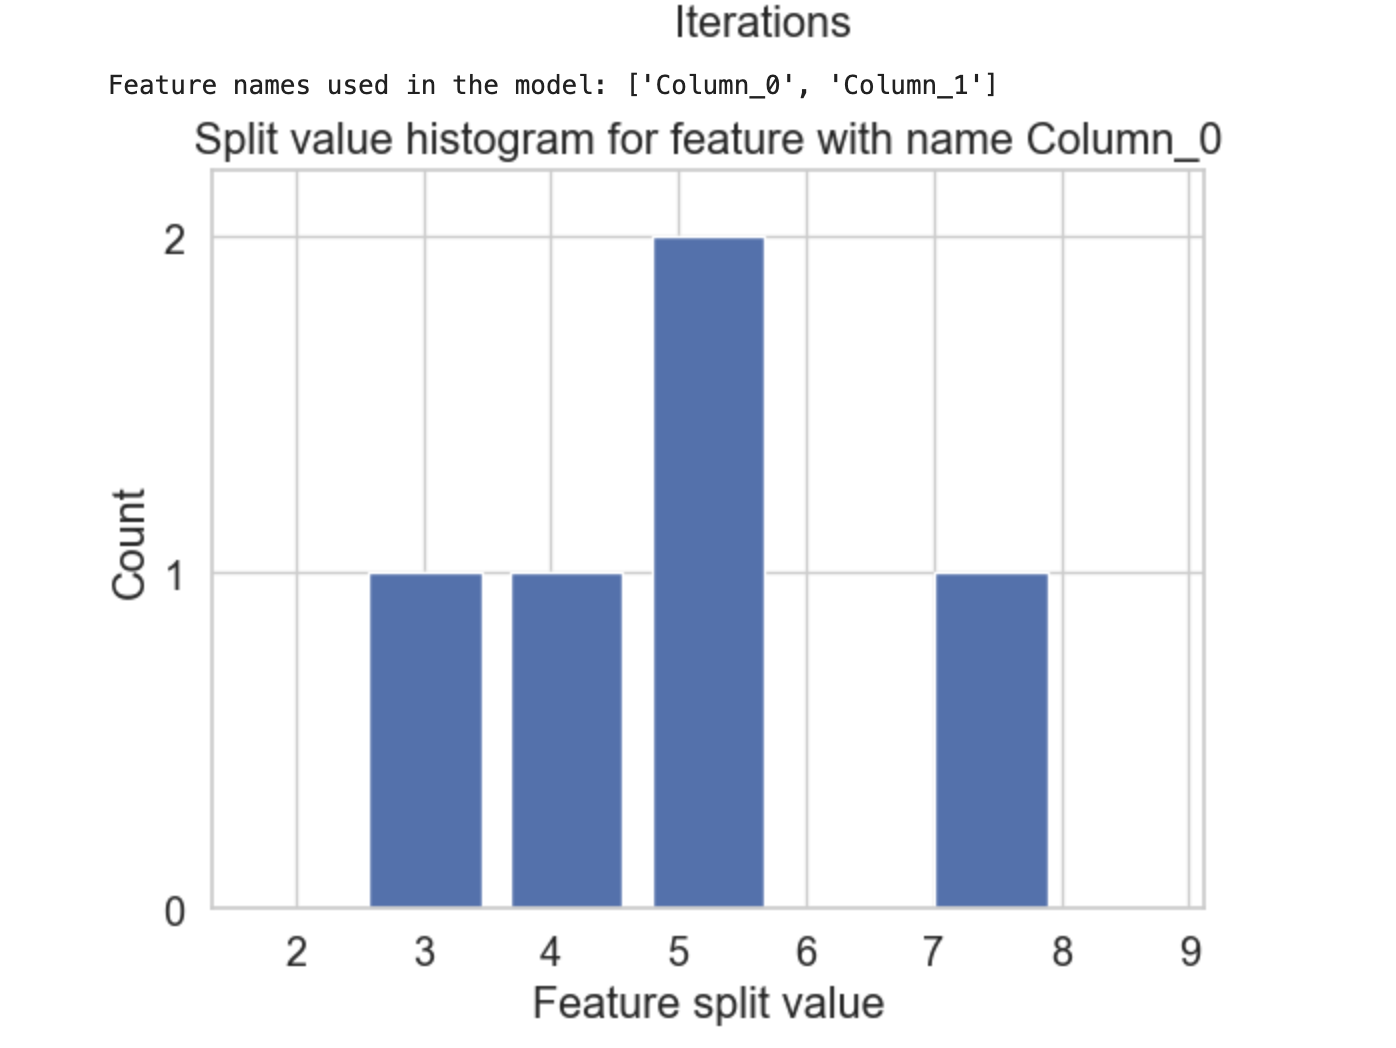
The plot_split_value_histogram() function basically accepts an input booster object and feature name/index. After that it plots a split value histogram for the given feature.
Syntax
Here is the syntax you can use for plot_split_value_histogram() function −
lightgbm.plot_split_value_histogram(
   booster,
   feature,
   bins=100,
   ax=None,
   width_coef=0.8,
   xlim=None,
   ylim=None,
   title=None,
   xlabel=None,
   ylabel=None,
   figsize=None,
   dpi=None,
   grid=False,
)
Parameters
Here are the required and optional parameters of the plot_split_value_histogram() function:
booster − It is the trained LightGBM model also known as booster object.
feature − It is the name of the feature that you want to plot.
bins − It is the number of bins you can use for the histogram.
ax − It is the Matplotlib axes object which is optional. If it is given the plot will be drawn on this axes.
width_coef − It is coefficient for managing the width of the bars in the histogram.
xlim − It is the tuple for x-axis limit.
ylim − It is the tuple for y-axis limits.
title − It is the title of the plot.
xlabel − It is the label for the x-axis.
ylabel − It is the label for the y-axis.
figsize − It is the tuple for the size of the figure.
dpi − It is the dots per inch for the plot.
grid − This parameter uses the Boolean value to show a grid in the plot.
Example
Here is the way you can include the plot_split_value_histogram() function and see the result −
# Complete code is similar to the above mentioned example for plot_metric()
# Plot the split value histogram
lgb.plot_split_value_histogram(model, feature=feature_to_plot)
plt.show()
Output
This will create the below outcome:
plot_tree()
The plot_tree() function allows you to plot the single tree of the ensemble. For this we have to mention a booster object with the index of the tree for which we have to plot to it.
Syntax
Here is the syntax you can use for plot_split_value_histogram() function −
lightgbm.plot_tree(
   booster,
   tree_index=0,
   figsize=(10, 10),
   dpi=None,
   show_info=True,
   precision=3,
   orientation='horizontal',
   example_case=None,
)
Parameters
Here are the required and optional parameters of the plot_split_value_histogram() function:
booster − It is the booster or LGBMModel object which is to be plotted.
tree_index − It is the target axes object. If it is None then new figure and axes is created.
figsize − It is the index of a target tree to plot.
dpi − It is the resolution of the figure.
show_info − It is used to display additional information about each node in the tree.
precision − It is used to restrict the display of floating point values to a certain precision.
orientation − It is the orientation of the tree. Its value can be horizontal or vertical.
example_case − It is the single row which has the same structure as the training data.
create_tree_digraph()
The create_tree_digraph() method is used to display the structure of a given decision tree from a LightGBM model. It basically generates a graph which shows how the tree splits data at every node which makes it easy to understand the decision-making process of the model.
Syntax
Here is the syntax you can use for create_tree_digraph() function −
lightgbm.create_tree_digraph(
   booster,
   tree_index=0,
   show_info=None,
   precision=3,
   orientation='horizontal',
   example_case=None,
   max_category_values=10
)
Parameters
Here are the required and optional parameters of the create_tree_digraph() function:
booster − It is the booster or LGBMModel object to be converted.
tree_index − It is the index of a target tree to convert.
show_info − It is the information which should be shown in nodes. The values can be split_gain, internal_value, internal_count, internal_weight, leaf_count, leaf_weight and data_percentage.
precision − It is used to limit the display of floating-point values to a specific precision.
orientation − It is the orientation of the tree. The values can be horizontal or vertical.
example_case − It is the single row with the same structure as the training data.
max_category_values − It is the maximum number of category values to show in tree nodes. If the value of thresholds is larger than this value, it will be collapsed and shown on the label tooltip instead.
