- JFreeChart - Home
- JFreeChart - Overview
- JFreeChart - Installation
- JFreeChart - Architecture
- JFreeChart - Referenced APIs
- JFreeChart - Pie Chart
- JFreeChart - Bar Chart
- JFreeChart - Line Chart
- JFreeChart - XY Chart
- JFreeChart - 3D Chart/Bar Chart
- JFreeChart- Bubble Chart
- JFreeChart - TimeSeries Chart
- JFreeChart - File Interface
- JFreeChart - Database Interface
JFreeChart - XY Chart
The XY chart (scatter) is based on one data series consisting of a list of X and Y values. Each value pair (X,Y) is a point in a coordinate system. Here, one value determines the horizontal (X) position, and the other determines the vertical (Y) position. This chapter demonstrates how we can use JFreeChart to create XY Chart from a given set of business data.
Business Data
Consider an example where we want to create an XY chart for all major browsers. Here, different performance scores are gathered from different categories of people as shown below −
| Firefox | Category(X) | Score(Y) |
|---|---|---|
| 1.0 | 1.0 | |
| 2.0 | 4.0 | |
| 3.0 | 3.0 | |
| Chrome | Category(X) | Score(Y) |
| 1.0 | 4.0 | |
| 2.0 | 5.0 | |
| 3.0 | 6.0 | |
| IE | Category(X) | Score(Y) |
| 3.0 | 4.0 | |
| 4.0 | 5.0 | |
| 5.0 | 4.0 |
AWT Based Application
Following is the code to create an XY Chart from the above given information. This code helps you to embed an XY chart in any AWT based application.
import java.awt.Color;
import java.awt.BasicStroke;
import org.jfree.chart.ChartPanel;
import org.jfree.chart.JFreeChart;
import org.jfree.data.xy.XYDataset;
import org.jfree.data.xy.XYSeries;
import org.jfree.ui.ApplicationFrame;
import org.jfree.ui.RefineryUtilities;
import org.jfree.chart.plot.XYPlot;
import org.jfree.chart.ChartFactory;
import org.jfree.chart.plot.PlotOrientation;
import org.jfree.data.xy.XYSeriesCollection;
import org.jfree.chart.renderer.xy.XYLineAndShapeRenderer;
public class XYLineChart_AWT extends ApplicationFrame {
public XYLineChart_AWT( String applicationTitle, String chartTitle ) {
super(applicationTitle);
JFreeChart xylineChart = ChartFactory.createXYLineChart(
chartTitle ,
"Category" ,
"Score" ,
createDataset() ,
PlotOrientation.VERTICAL ,
true , true , false);
ChartPanel chartPanel = new ChartPanel( xylineChart );
chartPanel.setPreferredSize( new java.awt.Dimension( 560 , 367 ) );
final XYPlot plot = xylineChart.getXYPlot( );
XYLineAndShapeRenderer renderer = new XYLineAndShapeRenderer( );
renderer.setSeriesPaint( 0 , Color.RED );
renderer.setSeriesPaint( 1 , Color.GREEN );
renderer.setSeriesPaint( 2 , Color.YELLOW );
renderer.setSeriesStroke( 0 , new BasicStroke( 4.0f ) );
renderer.setSeriesStroke( 1 , new BasicStroke( 3.0f ) );
renderer.setSeriesStroke( 2 , new BasicStroke( 2.0f ) );
plot.setRenderer( renderer );
setContentPane( chartPanel );
}
private XYDataset createDataset( ) {
final XYSeries firefox = new XYSeries( "Firefox" );
firefox.add( 1.0 , 1.0 );
firefox.add( 2.0 , 4.0 );
firefox.add( 3.0 , 3.0 );
final XYSeries chrome = new XYSeries( "Chrome" );
chrome.add( 1.0 , 4.0 );
chrome.add( 2.0 , 5.0 );
chrome.add( 3.0 , 6.0 );
final XYSeries iexplorer = new XYSeries( "InternetExplorer" );
iexplorer.add( 3.0 , 4.0 );
iexplorer.add( 4.0 , 5.0 );
iexplorer.add( 5.0 , 4.0 );
final XYSeriesCollection dataset = new XYSeriesCollection( );
dataset.addSeries( firefox );
dataset.addSeries( chrome );
dataset.addSeries( iexplorer );
return dataset;
}
public static void main( String[ ] args ) {
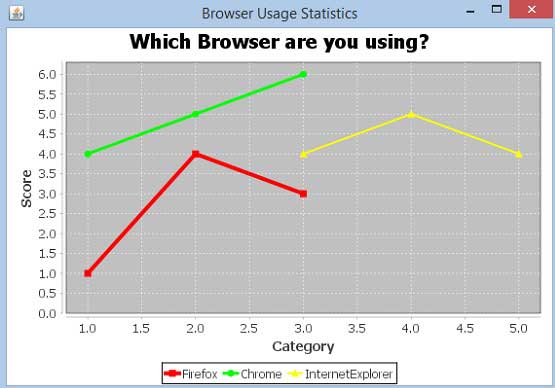
XYLineChart_AWT chart = new XYLineChart_AWT("Browser Usage Statistics",
"Which Browser are you using?");
chart.pack( );
RefineryUtilities.centerFrameOnScreen( chart );
chart.setVisible( true );
}
}
Let us keep the above Java code in XYLineChart_AWT.java file, and then compile and run it from the command prompted as:
$javac XYLineChart_AWT.java
$java XYLineChart_AWT
If everything is fine, it will compile and run to generate the following XY Graph −
JPEG Image Creation
Let us re-write the above example to generate a JPEG image from the command line.
import java.io.*;

import org.jfree.chart.ChartFactory;
import org.jfree.chart.JFreeChart;
import org.jfree.data.xy.XYSeries;
import org.jfree.chart.plot.PlotOrientation;
import org.jfree.data.xy.XYSeriesCollection;
import org.jfree.chart.ChartUtilities;

public class XYLineChart_image {

   public static void main( String[ ] args )throws Exception {
      final XYSeries firefox = new XYSeries( "Firefox" );
      firefox.add( 1.0 , 1.0 );
      firefox.add( 2.0 , 4.0 );
      firefox.add( 3.0 , 3.0 );

      final XYSeries chrome = new XYSeries( "Chrome" );
      chrome.add( 1.0 , 4.0 );
      chrome.add( 2.0 , 5.0 );
      chrome.add( 3.0 , 6.0 );

      final XYSeries iexplorer = new XYSeries( "InternetExplorer" );
      iexplorer.add( 3.0 , 4.0 );
      iexplorer.add( 4.0 , 5.0 );
      iexplorer.add( 5.0 , 4.0 );

      final XYSeriesCollection dataset = new XYSeriesCollection( );
      dataset.addSeries( firefox );
      dataset.addSeries( chrome );
      dataset.addSeries( iexplorer );

      JFreeChart xylineChart = ChartFactory.createXYLineChart(
         "Browser usage statastics",
         "Category",
         "Score",
         dataset,
         PlotOrientation.VERTICAL,
         true, true, false);

      int width = 640;   /* Width of the image */
      int height = 480;  /* Height of the image */
      File XYChart = new File( "XYLineChart.jpeg" );
      ChartUtilities.saveChartAsJPEG( XYChart, xylineChart, width, height);
   }
}
Let us keep the above Java code in XYLineChart_image.java file, and then compile and run it from the command prompted as −
$javac XYLineChart_image.java
$java XYLineChart_image
If everything is fine, it will compile and run to create a JPEG image file named XYLineChart.jpeg in your current directory.
