- JFreeChart - Home
- JFreeChart - Overview
- JFreeChart - Installation
- JFreeChart - Architecture
- JFreeChart - Referenced APIs
- JFreeChart - Pie Chart
- JFreeChart - Bar Chart
- JFreeChart - Line Chart
- JFreeChart - XY Chart
- JFreeChart - 3D Chart/Bar Chart
- JFreeChart- Bubble Chart
- JFreeChart - TimeSeries Chart
- JFreeChart - File Interface
- JFreeChart - Database Interface
JFreeChart - Quick Guide
JFreeChart - Overview
A chart is a graphical representation of information. There are various tools available, which can be used to create different types of charts. The JFreeChart project was founded in February 2000, by David Gilbert. Today, it is the most widely used charting library among Java developers.
This tutorial will help you understand what exactly JFreeChart is, why is it required, and the various ways to create different types of charts within a Java-based application or independently.
What is JFreeChart?
JfreeChart is an open source library developed in Java. It can be used within Java based applications to create a wide range of charts. By using JFreeChart, we can create all the major type of 2D and 3D charts such as pie chart, bar chart, line chart, XY chart and 3D charts.
Why JFreeChart?
JFreeChart is open source and 100% free, which permits usage in the commercial applications without any cost. We have enlisted here some more points in favor of why you should use JFreeChart −
It comes with well documented APIs, which makes it quite easy to understand.
It supports a wide range of chart types such as Pie Chart, Line Chart, Bar Chart, Area Chart and 3D charts.
JFreeChart is easy to extend and can be used in both, the client-side, as well as the server-side applications.
It supports multiple output formats like PNG, JPEG, PDF, SVG etc.
It allows extensive customizations of charts.
Consider a situation where you are developing an application and you need to show the data in the form of charts, and the data itself is populated dynamically. In such case, displaying the data in the form of charts using JFreeChart programming is very simple.
JFreeChart - Installation
JFreeChart is popular for its efficient chart creation and user-friendly installation setup. This chapter describes the process of setting up JFreeChart on Windows and Linux. User administration is needed while installing JFreeChart.
System Requirements
| JDK | 1.5 or above |
| Memory | 2GB RAM |
| Disk Space | No minimum requirement |
| Operating System Version | Linux or Windows |
Installing JFreeChart
To install JFreeChart, there are three following steps viz
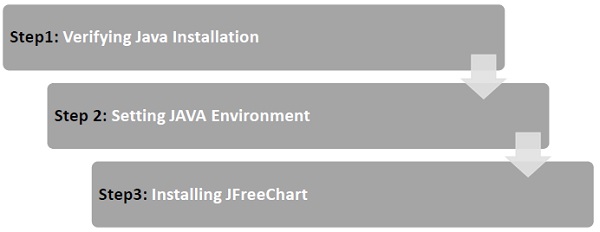
Step 1: Verifying Java Installation
To verify Java installation, open the console and execute the following java command −
| Os | Task | Command |
|---|---|---|
| Windows | Open command console | C:>java -version |
| Linux | Open command terminal | $java -version |
Once Java installation is done properly, then you should get the following output for both the operating systems −
| S.No | OS & Description |
|---|---|
| 1 | Windows Java version "1.7.0_60" Java (TM) SE Run Time Environment (build 1.7.0_60-b19) Java HotSpot(TM) 64-bit Server VM (build 24.60-b09,mixed mode) |
| 2 | Linux java version "1.7.0_25" OpenJDK Runtime Environment (rhel2.3.10.4.el6_4-x86_64) OpenJDK 64-Bit Server VM (build 23.7-b01, mixed mode) |
If you do not have Java installed, then install the Java Software Development Kit (SDK) from the link −
https://www.oracle.com/technetwork/java/javase/downloads/index.html
We assume that you have installed Java 1.7.0_60 version before proceeding for this tutorial.
Step 2: Setting JAVA Environment
Set the JAVA_HOME environment variable to point to the base directory location where Java is installed on your machine. For example,
| S.No | Os & Description |
|---|---|
| 1 | Windows Set Environmental variable JAVA_HOME to C:\ProgramFiles\java\jdk1.7.0_60 |
| 2 | Linux export JAVA_HOME=/usr/local/java-current |
Append Java compiler location to System Path.
| S.No | OS & Description |
|---|---|
| 1 | Windows Append the String; C:\Program Files\Java\jdk1.7.0_60\bin to the end of the system variable PATH. |
| 2 | Linux export PATH=$PATH:$JAVA_HOME/bin/ |
Verify the command java -version from the command prompted as explained above.
Step 3: Installing JFreeChart
Download the latest version of JFreeChart.zip from the link http://www.jfree.org/jfreechart/download/ Unzip the downloaded file at any location from where required libraries can be linked into your Java program. The following image shows the structure of the directories and files −
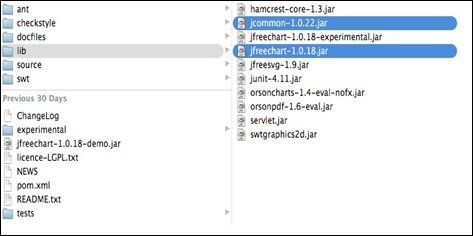
Add complete path of jfreechart-1.0.18.jar and jcommon-1.0.22.jar files to the CLASSPATH as shown below −
| S.No | OS & Description |
|---|---|
| 1 | Windows Append the Strings C:\ jfreechart-1.0.18\lib\ jfreechart-1.0.18.jar and C:\ jfreechart-1.0.18\lib\ jcommon-1.0.22.jar to the end of the user variable CLASSPATH |
| 2 | Linux Export CLASSPATH=$CLASSPATH: /usr/share/jfreechart1.0.18/lib/jfreechart-1.0.18.jar: /usr/share/jfreechart-1.0.18/lib/jcommon1.0.22.jar |
Note − Inorder to communicate with MySql database you need to set the classpath to mysql-connector-java-5.0.8-bin.jar too.
JFreeChart - Architecture
This chapter explains basic class level and application level architectures of JFreeChart to give you an idea about how JFreeChart interacts with different classes and how it fits in your Java based application.
Class Level Architecture
The class level architecture explains how various classes from the library interact with each other to create various types of charts.
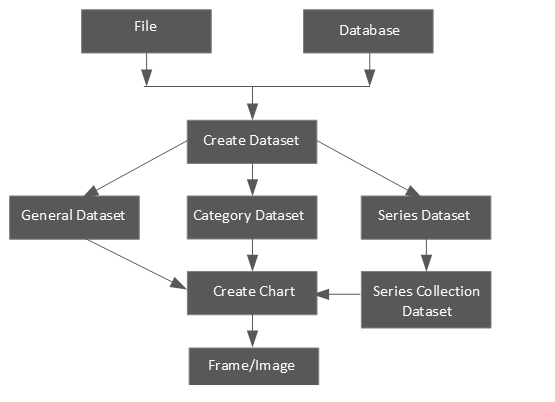
Following is the detail of the units used in the above block diagram −
| S.No | Units & Description |
|---|---|
| 1 | File The source having user input to be used for creating a dataset in the file. |
| 2 | Database The source having user input to be used for creating a dataset in the database. |
| 3 | Create Dataset Accepts the dataset and stores the dataset into dataset object. |
| 4 | General Dataset This type of dataset is mainly used for pie charts. |
| 5 | Category Dataset This type of dataset is used for bar chart, line chart,etc. |
| 6 | Series Dataset This type of dataset is used for storing series of data and construct line charts. |
| 7 | Series Collection Dataset The different categories of series datasets are added to series collection dataset. This type of dataset is used for XYLine Charts. |
| 8 | Create Chart This is the method which is executed to create final chart. |
| 9 | Frame/Image The chart is displayed on a Swing Frame or an image is created. |
Application Level Architecture
The application level architecture explains where JFreeChart library sits inside a Java Application.
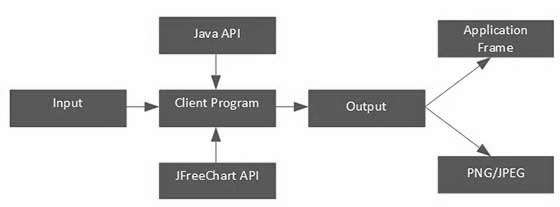
The client program receives user data and then it uses standard Java and JFreeChart APIs based on requirements to generate the output in the form of either a frame, which can be displayed directly inside the application or independently in the image formats such as JPEG or PNG.
JFreeChart - Referenced APIs
In this chapter, we will discuss about some of the important packages, classes, and methods from JFreeChart library. These packages, classes, and methods are the most frequently used while creating a variety of charts using JFreeChart library.
ChartFactory Class
ChartFactory is an abstract class under the org.jfree.chart package. It provides a collection of utility methods for generating standard charts.
Following is a list of few of the important methods −
Class Constructor
| S.No | Description |
|---|---|
| 1 | ChartFactory() Default constructor of ChartFactory class. |
Class Methods
| S.No | Methods & Description |
|---|---|
| 1 | createPieChart(java.lang.String title, PieDataset dataset, boolean legend, boolean tooltips, boolean urls) This method creates a pie chart with default settings. It returns JfreeChart type object. |
| 2 | createPieChart3D(java.lang.String title, PieDataset dataset, boolean legend, boolean tooltips, boolean urls This method creates a 3D pie chart using the specified dataset. |
| 3 | createBarChart(java.lang.String title, java.lang.String categoryAxisLabel, java.lang.String valueAxisLabel, CategoryDataset dataset, PlotOrientation orientation, boolean legend, boolean tooltips, boolean urls) The argument java.lang.String categoryAxisLabel is the label for values placed on X-axis. The argument java.lang.String valueAxisLabel is the label for values placed on Y-axis. This method creates a bar chart. |
| 4 | createBarChart3D(java.lang.String title, java.lang.String categoryAxisLabel, java.lang.String valueAxisLabel, CategoryDataset dataset, PlotOrientation orientation, boolean legend, boolean tooltips, boolean urls) This Method Creates a bar chart with a 3D effect. It returns JfreeChart type object. |
| 5 | createLineChart(java.lang.String title, java.lang.String categoryAxisLabel, java.lang.String valueAxisLabel, CategoryDataset dataset, PlotOrientation orientation, boolean legend, boolean tooltips, boolean urls) This method creates a line chart with default settings. |
| 6 | createLineChart3D(java.lang.String title, java.lang.String categoryAxisLabel, java.lang.String valueAxisLabel, CategoryDataset dataset, PlotOrientation orientation, boolean legend, boolean tooltips, boolean urls) This method creates a line chart with 3D effect. |
| 7 | createXYLineChart(java.lang.String title, java.lang.String xAxisLabel, java.lang.String yAxisLabel, XYDataset dataset, PlotOrientation orientation, boolean legend, boolean tooltips, boolean urls) This method creates a line chart based on XYDataset with default settings. |
ChartFrame Class
ChartFrame class under the org.jfree.chart package, provides all frame related functions and utilities. ChartFrame class inherits functionalities from parent classes such as Frame, Window, Container, and Component classes.
Class Constructor
| S.No | Constructor and Description |
|---|---|
| 1 | ChartFrame (java.lang.Frame String, JfreeChart chart) It constructs a frame. |
| 2 | Chart Frame (java.lang.Frame String, JfreeChart chart, boolean scrollpane) It constructs a frame. |
Class Method
| S.No | Method and Description |
|---|---|
| 1 | getChartPanel() This method returns the chart panel for a frame. |
ChartPanel Class
ChartPanel class from the org.jfree.chart package is used as a swing GUI component for displaying JfreeChart object.
Class Constructor
| S.No | Constructor and Description |
|---|---|
| 1 | ChartPanel(JFreeChart chart) This constructor constructs a panel that displays the specified chart. |
| 2 | ChartPanel(JFreeChart chart, boolean useBuffer) This constructor constructs a panel containing a chart. |
| 3 | ChartPanel(JFreeChart chart, boolean properties, boolean save, boolean print, boolean zoom, boolean tooltips) This constructor constructs a JFreeChart panel. |
Class Method
| S.No | Method and Description | 1 | setPreferredSize(java.awt.Dimension) This method is used to set the frame size using java.awt. Dimension class object as an argument. This method is taken from javax.swing.JComponent. |
|---|
ChartUtilities Class
CharUtilites class from the org.jfree.chart package provides a collection of utility methods of JFreeCharts including methods for converting charts into image file format such as PNG, JPEG, and creating HTML image maps.
Class Constructor
| S.No | Constructor and Description |
|---|---|
| 1 | ChartUtilities() This is a default constructor of a class |
Class Method
| S.No | Method and Description |
|---|---|
| 1 | saveChartAsPNG(java.io.File file, JfreeChart chart, int width, int height) This method converts and saves a chart to the specified file in PNG format. |
| 2 | saveChartAsJPEG(java.io.File file, JfreeChart chart, int width, int height) This method converts and saves a chart to the specified file in JPEG format. |
JFreeChart Class
JFreeChart class is the core class under the org.jfree.chart package. This class provides JFreeChart method to create bar charts, line charts, pie charts, and xy plots including time series data.
Class Constructor
| S.No | Constructor and Description |
|---|---|
| 1 | JfreeChart(Plot plot) This constructor creates a new chart based on the supplied plot. |
| 2 | JfreeChart(java.lang.String title, java.awt.Font titleFont, Plot plot, boolean createLegend) This constructor creates a new chart with the given title and plot. |
| 3 | JfreeChart(java.lang.String title, Plot plot) This constructor creates a new chart with the given title and plot. |
Class Method
| S.No | Method and Description |
|---|---|
| 1 | getXYPlot() This method Returns the plot chart as XYPlot. Using XYPolt, we can do some utility operations on xy charts. |
PiePlot Class
This class is a part of org.jfree.chart.plot package and extends Plot class from the same package. This class provides methods to create Pie Plots.
Class Constructor
| S.No | Constructor and Description |
|---|---|
| 1 | PiePlot() It creates a new plot. |
| 2 | PiePlot(PieDataset dataset) It creates a plot that draws a pie chart for the specified dataset. |
Class Method
| S.No | Method and Description |
|---|---|
| 1 | setStartAngle(double angle) This Method sets the starting angle and sends a PlotChangeEvent to all registered listeners |
PiePlot3D Class
PiePlot3D class is a subclass of PiePlot class under the same package. Hence, this class has the same features as PiePlot class, except it is used to create 3D plots.
Class Constructor
| S.No | Constructor and Description |
|---|---|
| 1 | PiePlot3D() This constructor creates a new instance with no dataset. |
| 2 | PiePlot3D(PieDataset dataset) This constructor creates a pie chart with three dimensional effect using a specified dataset. |
Class Method
| S.No | Method and Description |
|---|---|
| 1 | setForegroundAlpha(float alpha) It sets the alpha-transparency for the plot and sends a PlotChangeEvent to all registered listeners. This is taken from one of the parent Plot classes. |
| 2 | setInteriorGap(double percent) It sets the interior gap and sends a PlotChangeEvent to all registered listeners. This controls the space between the edges of the pie plot and the plot area itself (i. e., the region where the section labels appear). This method is taken from the parent class PiePlot. |
PlotOrientation Class
This is a serialized class available in org.jfree.chart.plot package and it is used to show the orientation of a 2D plot. The orientation can either be vertical or horizontal. It sets the orientation of Y-axis. A conventional plot has a vertical Y- axis.
Field summary
| S.No | Type | Field & Description |
|---|---|---|
| 1 | PlotOrientation | HORIZONTAL For a plot where the range axis(Y-axis) is horizontal. |
| 2 | PlotOrientation | VERTICAL For a plot where the range axis(Y-axis) is vertical. This is the default orientation. |
Class Method
| S.No | Method and Description |
|---|---|
| 1 | isHorizontal() This method returns true if this orientation is HORIZONTAL, and false otherwise. |
| 2 | isVertical() This Method returns true if this orientation is VERTICAL, and false otherwise. |
XYPlot Class
This is a general class available in org.jfree.chart.plot package and it is used for the plotting data in the form of (x,y) pairs. This plot can use data from any other class that implements the XYDataSet Interface. XYPlot makes use of a XYItemRenderer to draw each point on the plot.
Class Constructor
| S.No | Constructor and Description |
|---|---|
| 1 | XYPlot() This contractor creates a new XYPlot instance with no dataset, no axes and no renderer. |
| 2 | XYPlot(XYDataset dataset, ValueAxis domainAxis, ValueAxis rangeAxis, XYItemRenderer renderer) This constructor creates a new plot with the specified dataset, axis, and renderer. |
Class Method
| S.No | Method and Description |
|---|---|
| 1 | setRenderer(XYItemRenderer renderer) This method sets the renderer for the primary dataset and sends a change event to all registered listeners. |
NumberAxis Class
This class is available in org.jfree.chart.axis package and it can access the numerical data of any axis. When we set the range of any axis to default, it fits according to the range of the data. But using NumberAxis, class we can set the lower margin and upper margin of domain and range axes.
Class Constructor
| S.No | Constructor and Description |
|---|---|
| 1 | NumberAxis( ) This is a default Constructor of NumberAxis. |
| 2 | NumberAxis( java.lang.String label) The constructor NumberAxis uses default values where necessary. |
Class Method
| S.No | Method and Description |
|---|---|
| 1 | setLowerMargin(double margin) It sets the lower margin for the axis (as a percentage of the axis range) and sends an AxisChangeEvent to all registered listeners. This method is taken from parent class of the class ValueAxis. |
| 2 | setUpperMargin(double margin) It sets the upper margin for the axis (as a percentage of the axis range) and sends an AxisChangeEvent to all registered listeners. This method is also present in ValueAxis Class. |
XYLineAndShapeRenderer Class
This is the class, available under org.jfree.chart.renderer.xy package, which takes care of connecting data points with lines and draws shapes at each data point. This renderer class is designed for use with the XYPlot class.
Class Constructor
| S.No | Constructor & Description |
|---|---|
| 1 | XYLineAndShapeRenderer() It creates a new renderer with both lines and shapes visible. |
| 2 | XYLineAndShapeRenderer (boolean lines, boolean shapes) It creates a new renderer with specific property. |
Class Method
| S.No | Method and Description |
|---|---|
| 1 | setSeriesPaint(int series, java.awt.Paint paint) This method sets the paint used for a series and sends a RendererChangeEvent to all registered listeners. This method is taken from AbstratRenderer abstract class from renderer package in JFreeChart API. |
| 2 | setSeriesStroke(int series, java.awt.Stroke stroke) This method Sets the stroke used for a series and sends a RendererChangeEvent to all registered listeners. This method is taken from AbstratRenderer abstract class, which is super class of this package. |
XYItemRenderer general datasets
This is an interface for rendering the format of a single (x, y) item on a XYPlot. The package is org.Jfree.data.general, which has classes and interfaces to define different types of datasets to construct charts.
PieDataset
This is an interface used as a general purpose dataset, where values are associated with keys. As the name suggests, you can use this dataset to supply data for pie charts. This interface extends KeyedValues and DataSet interfaces. All the methods used for this interface are taken from KeyedValues, Values, and Dataset interfaces.
DefaultPieDataset Class
This is a Default implementation class of a PieDataset interface.
Class Constructor
| S.No | Constructor and Description |
|---|---|
| 1 | DefaultPieDataset() This constructor creates a new dataset, initially empty. |
| 2 | DefaultPieDataset(KeyedValues data) It creates a new dataset by copying data from a KeyedValues instance. |
Class Method
| S.No | Method & Description |
|---|---|
| 1 | setValue(java.lang.Comparable key, double value) It sets the data value for a key and sends a DatasetChangeEvent to all registered listeners. |
| 2 | setValue(java.lang.Comparable key, java.lang.Number value) It sets the data value for a key and sends a DatasetChangeEvent to all registered listeners. |
SeriesException Class
This is an exception class. It raises an exception occurred in the time series of data in the dataset. Exceptions are raised on the occurrence of duplicate or invalid data. The time series must not be applied with duplicates and the format must be valid.
DefaultCategoryDataset
This is a default implementation class of CategoryDataset interface.
Class Constructor
| S.No | Constructor and Description |
|---|---|
| 1 | DefaultCategoryDataset() This constructor creates new empty dataset. |
Class Method
| S.No | Method and Description |
|---|---|
| 1 | addValue(double value, java.lang.Comparable rowKey, java.lang.Comparable columnKey) This method adds a value to the table using comparable keys. |
| 2 | addValue(java.lang.Number value, java.lang.Comparable rowKey, java.lang.Comparable columnKey) This method adds a value to the table. |
| 3 | setValue(double value, java.lang.Comparable rowKey, java.lang.Comparable columnKey) This method adds or updates a value in the table and sends a DatasetChangeEvent to all registered listeners. |
| 4 | setValue(java.lang.Number value, java.lang.Comparable rowKey, java.lang.Comparable columnKey) This method adds or updates a value in the table and sends a DatasetChangeEvent to all registered listeners. |
Refer JFreeChart API for more information on various other methods and fields.
Series Datasets
The series dataset is used by XY charts. The package is org.Jfree.data.xy, which contains classes and interfaces belonging to xy charts. The core interface is XYDataset.
XYDataset
This is an interface through which data in the form of (x,y) items can be accessed. As the name suggests, you can use this dataset to serve XY chart. Some of the methods in this interface are taken from SeriesDateset interface.
XYZDataset
This is an interface through which data in the form of (x,y,z) items can be accessed. As the name suggests, you can use this dataset to serve XYZ chart. Some of the methods in this interface are taken from SeriesDateset.
XYSeries
This is a class, which represents a sequence of zero or more data items in the form (x, y). By default, the items in the series are sorted into ascending order by x-value, and duplicate x-values are permitted. Both the sorting and duplicate defaults can be changed in the constructor. Y-values can be denoted as null to represent missing values.
Class Constructor
| S.No | Constructor and Description |
|---|---|
| 1 | XYSeries(java.lang.Comparable key) This constructor creates a new empty series. |
| 2 | XYSeries(java.lang.Comparable key, boolean autoSort) It constructs a new empty series, with the auto-sort flag set as requested, and duplicate values are allowed. |
| 3 | XYSeries(java.lang.Comparable key, boolean autoSort, boolean allowDuplicateXValues) It constructs a new xy-series that contains no data. |
Class Method
| S.No | Method and Description |
|---|---|
| 1 | add(double x, double y) This method adds data item into the series. |
The above method is used in the tutorial example. If you want to learn the remaining methods and fields, please refer JFreeChart API.
XYSeriesCollection
XYSeriesCollection class has parent classes like AbstractIntervelDataset, AbstractXYDatset, AbstractSeriesDataset and AbstractDataset. Some of the methods in this class belong to parent classes of this class.
Class Constructor
| S.No | Constructor and Description |
|---|---|
| 1 | XYSeriesCollection() It constructs an empty dataset. |
| 2 | XYSeriesCollection(XYSeries xyseries) It constructs a dataset and populates it with a single series. |
Class Method
| S.No | Method and Description |
|---|---|
| 1 | addSeries(XYSeries series) This method adds a series to the collection and sends a DatasetChangeEvent to all registered listeners. |
Refer JFreeChart API for the remaining methods and fields.
Default XYZDataset
DefaultXYZDataset class have parent classes like AbstractIntervelDataset, AbstractXYDatset, AbstractSeriesDataset, AbstractDataset and AbstractXYZDataset. Some of the methods in this class belong to parent classes of this class.
class constructor
| S.No | Constructor and Description |
|---|---|
| 1 | DefaultXYZDataset() It constructs an empty dataset. |
Class Method
| S.No | Method and Description |
|---|---|
| 1 | addSeries(java.lang.Comparable seriesKey, double[ ][ ] data ) This method adds a series to the collection and sends a DatasetChangeEvent to all registered listeners. |
Please refer JFreeChart API for the remaining methods and fields.
Time Series in JFreeCharts
The package is org.jfree.data.time. This package contains classes and interfaces, which are used for the time related data.
TimeSeries
This class represents a sequence of data items in the form of period values, where period is some instance of RegularTimePeriod abstract class such as Time, Day, Hour, Minute, and Second classes.
Class Constructor
| S.No | Constructor and Description |
|---|---|
| 1 | TimeSeries(java.lang.Comparable name) It creates new empty series. |
| 2 | TimeSeries(java.lang.Comarable name, java.lang.String domain, java.lang.Strin range) It creates new time series that contains no data. |
Class Method
| S.No | Method and Description |
|---|---|
| 1 | add(RegularTimePeriod period,double value) This method adds a new data item to the series. |
Refer JFreeChart API for the remaining methods and fields.
TimeSeriesCollection
This is a class used as a collection of time series objects. This class implements the XYDataset interface, as well as it extends IntervelXYDataset interface. This makes it convenient to collect series data objects.
Class Constructor
| S.No | Constructor and Description |
|---|---|
| 1 | TimeSeriesCollection() It constructs an empty dataset, tied to the default time zone. |
| 2 | TimeSeriesCollection(TimeSeries series) It constructs a dataset containing a single series (more can be added), tied to the default time zone. |
| 3 | TimeSeriesCollection(TimeSeries series, java.util.TimeZone zone) It constructs a dataset containing a single series (more can be added), tied to a specific time zone. |
| 4 | TimeSeriesCollection(java.util.TimeZone zone) It constructs an empty dataset, tied to a specific time zone. |
Class Method
| S.No | Method and Description |
|---|---|
| 1 | addSeries(TimeSeries series) This method adds a series to the collection and sends a DatasetChangeEvent to all registered listeners. |
Please refer JFreeChart API for the remaining methods and fields.
Second
This class represents a second in a particular day. This class is immutable, which is a requirement for all RegularTimePeriod subclass.
Class Constructor
| S.No | Constructor and Description |
|---|---|
| 1 | Second() It constructs a new Second, based on the system date/time. |
| 2 | Second(java.util.Date time) It constructs a new instance from the specified date/time and the default time zone. |
| 3 | Second(java.util.Date time, java.util.TimeZone zone, java.util.Locale locale) It creates a new second based on the supplied time and time zone. |
| 4 | Second(int second, int minute, int hour, int day, int month, int year It creates a new second. |
| 5 | Second(int second, Minute minute) It constructs a new Second. |
Class Method
| S.No | Method and Description |
|---|---|
| 1 | getSecond() It returns the second within the minute. |
| 2 | next() It returns the second following the present second. |
Please refer JFreeChart API for the remaining methods and fields.
Frames in JFreeCharts
The package is org.jfree.ui. This is the package belongs to JCommons API of JFreeChart. It contains utility classes used for creating frames for pre-configured charts.
ApplicationFrame
This is a base class for creating the main frame for simple applications. The frame listens for window closing events, and responds by shutting down the JVM. This is fine for small demo applications. For enterprise applications, you need to use something more robust. The main core methods in this class are taken from Component, Container, Window, Frame, and Jframe classes.
Class Constructor
| S.No | Constructor & Description |
|---|---|
| 1 | ApplicationFrame(java.lang.String title) It creates an application frame with the string title. |
This class helps to create AWT Frames. This is the reason for why we use this class as super class in this tutorial examples.
The methods, which are taken form the parent classes are used for opening a frame, closing a frame, changing the size, changing the background or foreground color, and listeners.
RefineryUtilities
This is a class collection of utility methods relating to user interface.
Class Method
| S.No | Method and Description |
|---|---|
| 1 | centerFrameOnScreen(java.awt.Window frame) It positions the specified frame in the middle of the screen. |
The above method is used in the tutorial example. Refer JFreeChart API for remaining methods and fields.
JFreeChart - Pie Chart
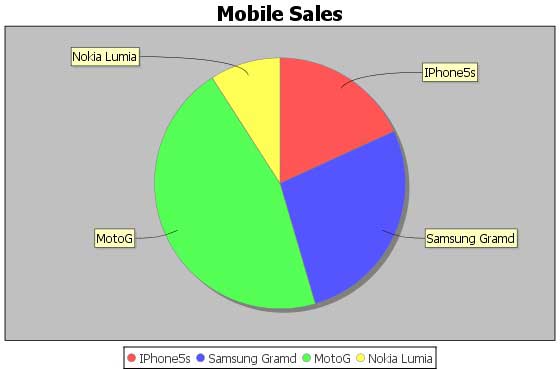
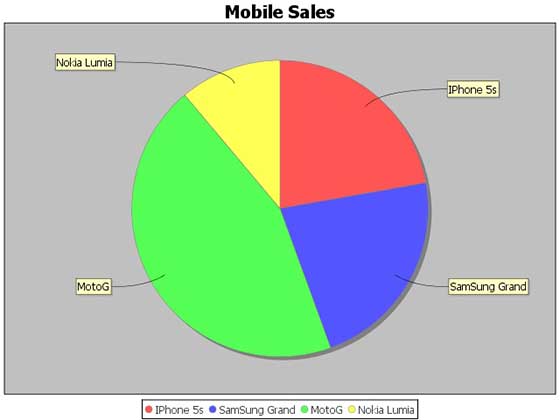
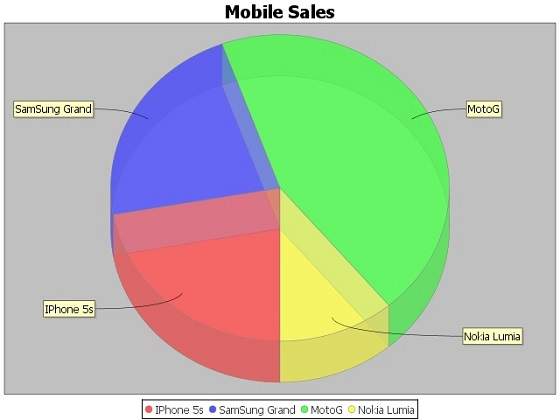
In a pie chart, the arc length of each sector is proportional to the quantity that it represents. This chapter demonstrates how we can use JFreeChart to create Pie Chart from a given set of business data.
Business data
The following example depicts mobile sale with the help of a pie chart. Following is a list of different mobile brands and their sale (units per day).
| S.No | Mobile Brands | Sales (UNITS per day) |
|---|---|---|
| 1 | Iphone 5S | 20 |
| 2 | Samsung Grand | 20 |
| 3 | MOTO G | 40 |
| 4 | Nokia Lumia | 10 |
AWT Based Application
Following is the code to create a Pie Chart by using the above given information. This code helps you to embed a pie chart in any AWT based application.
import javax.swing.JPanel;

import org.jfree.chart.ChartFactory;
import org.jfree.chart.ChartPanel;
import org.jfree.chart.JFreeChart;
import org.jfree.data.general.DefaultPieDataset;
import org.jfree.data.general.PieDataset;
import org.jfree.ui.ApplicationFrame;
import org.jfree.ui.RefineryUtilities;

public class PieChart_AWT extends ApplicationFrame {

   public PieChart_AWT( String title ) {
      super( title );
      setContentPane(createDemoPanel( ));
   }

   private static PieDataset createDataset( ) {
      DefaultPieDataset dataset = new DefaultPieDataset( );
      dataset.setValue( "IPhone 5s" , new Double( 20 ) );
      dataset.setValue( "SamSung Grand" , new Double( 20 ) );
      dataset.setValue( "MotoG" , new Double( 40 ) );
      dataset.setValue( "Nokia Lumia" , new Double( 10 ) );
      return dataset;
   }

   private static JFreeChart createChart( PieDataset dataset ) {
      JFreeChart chart = ChartFactory.createPieChart(
         "Mobile Sales",   // chart title
         dataset,          // data
         true,             // include legend
         true,
         false);

      return chart;
   }

   public static JPanel createDemoPanel( ) {
      JFreeChart chart = createChart(createDataset( ) );
      return new ChartPanel( chart );
   }

   public static void main( String[ ] args ) {
      PieChart_AWT demo = new PieChart_AWT( "Mobile Sales" );
      demo.setSize( 560 , 367 );
      RefineryUtilities.centerFrameOnScreen( demo );
      demo.setVisible( true );
   }
}
Let us keep the above Java code in PieChart_AWT.java file, and then compile and run it from the command prompted as −
$javac PieChart_AWT.java
$java PieChart_AWT
If everything is fine, it will compile and run to generate the following Pie Graph −
If you do not need to embed your chart in any application, then you can create chart images at command prompt. JFreeChart allows you to save chart images in either JPG or PNG formats.
JPEG Image Creation
Let us re-write the above example to generate a JPEG image from a command line. Following are the two APIs provided by JFreeChart library, which you can use to generate either PNG or JPEG image as per your requirement.
saveChartAsPNG() − API to save image in PNG format.
saveChartAsJPEG() − API to save image in JPEG format.
import java.io.*;

import org.jfree.chart.ChartUtilities;
import org.jfree.chart.ChartFactory;
import org.jfree.chart.JFreeChart;
import org.jfree.data.general.DefaultPieDataset;

public class PieChart {

   public static void main( String[ ] args ) throws Exception {
      DefaultPieDataset dataset = new DefaultPieDataset( );
      dataset.setValue("IPhone 5s", new Double( 20 ) );
      dataset.setValue("SamSung Grand", new Double( 20 ) );
      dataset.setValue("MotoG", new Double( 40 ) );
      dataset.setValue("Nokia Lumia", new Double( 10 ) );

      JFreeChart chart = ChartFactory.createPieChart(
         "Mobile Sales",   // chart title
         dataset,          // data
         true,             // include legend
         true,
         false);

      int width = 640;   /* Width of the image */
      int height = 480;  /* Height of the image */
      File pieChart = new File( "PieChart.jpeg" );
      ChartUtilities.saveChartAsJPEG( pieChart , chart , width , height );
   }
}
Let us keep the above Java code in PieChart.java file, and then compile and run it from the command prompted as −
$javac PieChart.java
$java PieChart
If everything is fine, it will compile and run to create a JPEG image file named PieChart.jpeg in your current directory.
JFreeChart - Bar Chart
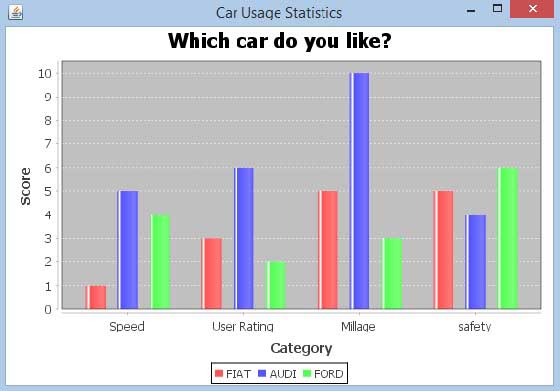
This chapter demonstrates how you can use JFreeChart to create Bar Chart from a given set of business data.
A bar chart uses different orientation (horizontal or vertical) bars to show comparisons in various categories. One axis (domain axis) of the chart shows the specific domain being compared, and the other axis (range axis) represents discrete values.
Business Data
The following example depicts various car statistics with the help of a bar chart. Following is a list of car brands along with their different characteristics, which we will show using a bar chart −
| Car | Speed | User Rating | Millage | Safety |
|---|---|---|---|---|
| Fiat | 1.0 | 3.0 | 5.0 | 5.0 |
| Audi | 5.0 | 6.0 | 10.0 | 4.0 |
| Ford | 4.0 | 2.0 | 3.0 | 6.0 |
AWT Based Application
Following is the code to create a Bar Chart from the above given information. This code helps you to embed a bar chart in any AWT based application.
import org.jfree.chart.ChartFactory;
import org.jfree.chart.ChartPanel;
import org.jfree.chart.JFreeChart;
import org.jfree.chart.plot.PlotOrientation;
import org.jfree.data.category.CategoryDataset;
import org.jfree.data.category.DefaultCategoryDataset;
import org.jfree.ui.ApplicationFrame;
import org.jfree.ui.RefineryUtilities;

public class BarChart_AWT extends ApplicationFrame {

   public BarChart_AWT( String applicationTitle , String chartTitle ) {
      super( applicationTitle );
      JFreeChart barChart = ChartFactory.createBarChart(
         chartTitle,
         "Category",
         "Score",
         createDataset(),
         PlotOrientation.VERTICAL,
         true, true, false);

      ChartPanel chartPanel = new ChartPanel( barChart );
      chartPanel.setPreferredSize(new java.awt.Dimension( 560 , 367 ) );
      setContentPane( chartPanel );
   }

   private CategoryDataset createDataset( ) {
      final String fiat = "FIAT";
      final String audi = "AUDI";
      final String ford = "FORD";
      final String speed = "Speed";
      final String millage = "Millage";
      final String userrating = "User Rating";
      final String safety = "safety";
      final DefaultCategoryDataset dataset =
      new DefaultCategoryDataset( );

      dataset.addValue( 1.0 , fiat , speed );
      dataset.addValue( 3.0 , fiat , userrating );
      dataset.addValue( 5.0 , fiat , millage );
      dataset.addValue( 5.0 , fiat , safety );

      dataset.addValue( 5.0 , audi , speed );
      dataset.addValue( 6.0 , audi , userrating );
      dataset.addValue( 10.0 , audi , millage );
      dataset.addValue( 4.0 , audi , safety );

      dataset.addValue( 4.0 , ford , speed );
      dataset.addValue( 2.0 , ford , userrating );
      dataset.addValue( 3.0 , ford , millage );
      dataset.addValue( 6.0 , ford , safety );

      return dataset;
   }

   public static void main( String[ ] args ) {
      BarChart_AWT chart = new BarChart_AWT("Car Usage Statistics",
         "Which car do you like?");
      chart.pack( );
      RefineryUtilities.centerFrameOnScreen( chart );
      chart.setVisible( true );
   }
}
Let us keep the above Java code in BarChart_AWT.java file, and then compile and run it from the command prompted as −
$javac BarChar_AWT.java
$java BarChart_AWT
If everything is fine, it will compile and run to generate the following Bar Graph −
JPEG Image Creation
Let us re-write the above example to generate a JPEG image from a command line.
import java.io.*;

import org.jfree.chart.ChartFactory;
import org.jfree.chart.JFreeChart;
import org.jfree.chart.plot.PlotOrientation;
import org.jfree.data.category.DefaultCategoryDataset;
import org.jfree.chart.ChartUtilities;

public class BarChart {

   public static void main( String[ ] args )throws Exception {
      final String fiat = "FIAT";
      final String audi = "AUDI";
      final String ford = "FORD";
      final String speed = "Speed";
      final String millage = "Millage";
      final String userrating = "User Rating";
      final String safety = "safety";

      final DefaultCategoryDataset dataset = new DefaultCategoryDataset( );
      dataset.addValue( 1.0 , fiat , speed );
      dataset.addValue( 3.0 , fiat , userrating );
      dataset.addValue( 5.0 , fiat , millage );
      dataset.addValue( 5.0 , fiat , safety );

      dataset.addValue( 5.0 , audi , speed );
      dataset.addValue( 6.0 , audi , userrating );
      dataset.addValue( 10.0 , audi , millage );
      dataset.addValue( 4.0 , audi , safety );

      dataset.addValue( 4.0 , ford , speed );
      dataset.addValue( 2.0 , ford , userrating );
      dataset.addValue( 3.0 , ford , millage );
      dataset.addValue( 6.0 , ford , safety );

      JFreeChart barChart = ChartFactory.createBarChart(
         "CAR USAGE STATIStICS",
         "Category", "Score",
         dataset,PlotOrientation.VERTICAL,
         true, true, false);

      int width = 640;    /* Width of the image */
      int height = 480;   /* Height of the image */
      File BarChart = new File( "BarChart.jpeg" );
      ChartUtilities.saveChartAsJPEG( BarChart , barChart , width , height );
   }
}
Let us keep the above Java code in BarChart.java file, and then compile and run it from the command prompted as −
$javac BarChart.java
$java BarChart
If everything is fine, it will compile and run to create a JPEG image file named BarChart.jpeg in your current directory.
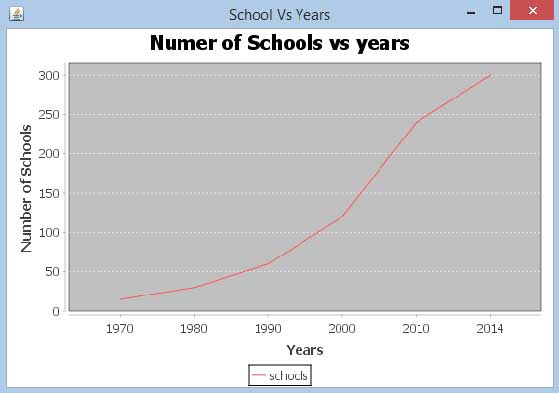
JFreeChart - Line Chart
A line chart or line graph displays information as a series of data points (markers) connected by straight line segments. Line Chart shows how data changes at equal time frequency.
This chapter demonstrates how we can use JFreeChart to create Line Chart from a given set of business data.
Business Data
The following example draws a line chart to show a trend of number of schools opened in different years starting from 1970.
Given data is as follows −
| Year | Number OF Schools |
|---|---|
| 1970 | 15 |
| 1980 | 30 |
| 1990 | 60 |
| 2000 | 120 |
| 2013 | 240 |
| 2014 | 300 |
AWT Based Application
Following is the code to create Line Chart from the information above given. This code helps you to embed a line chart in any AWT based application.
import org.jfree.chart.ChartPanel;
import org.jfree.chart.ChartFactory;
import org.jfree.chart.JFreeChart;
import org.jfree.ui.ApplicationFrame;
import org.jfree.ui.RefineryUtilities;
import org.jfree.chart.plot.PlotOrientation;
import org.jfree.data.category.DefaultCategoryDataset;

public class LineChart_AWT extends ApplicationFrame {

   public LineChart_AWT( String applicationTitle , String chartTitle ) {
      super(applicationTitle);
      JFreeChart lineChart = ChartFactory.createLineChart(
         chartTitle,
         "Years","Number of Schools",
         createDataset(),
         PlotOrientation.VERTICAL,
         true,true,false);

      ChartPanel chartPanel = new ChartPanel( lineChart );
      chartPanel.setPreferredSize( new java.awt.Dimension( 560 , 367 ) );
      setContentPane( chartPanel );
   }

   private DefaultCategoryDataset createDataset( ) {
      DefaultCategoryDataset dataset = new DefaultCategoryDataset( );
      dataset.addValue( 15 , "schools" , "1970" );
      dataset.addValue( 30 , "schools" , "1980" );
      dataset.addValue( 60 , "schools" ,  "1990" );
      dataset.addValue( 120 , "schools" , "2000" );
      dataset.addValue( 240 , "schools" , "2010" );
      dataset.addValue( 300 , "schools" , "2014" );
      return dataset;
   }

   public static void main( String[ ] args ) {
      LineChart_AWT chart = new LineChart_AWT(
         "School Vs Years" ,
         "Numer of Schools vs years");

      chart.pack( );
      RefineryUtilities.centerFrameOnScreen( chart );
      chart.setVisible( true );
   }
}
Let us keep the above Java code in LineChart_AWT.java file, and then compile and run it from the command prompted as −
$javac LineChart_AWT.java
$java LineChart_AWT
If everything is fine, it will compile and run to generate the following Line Graph −
JPEG Image Creation
Let us re-write the above example to generate a JPEG image from a command line.
import java.io.*;

import org.jfree.chart.JFreeChart;
import org.jfree.chart.ChartFactory;
import org.jfree.chart.ChartUtilities;
import org.jfree.chart.plot.PlotOrientation;
import org.jfree.data.category.DefaultCategoryDataset;

public class LineChart {

   public static void main( String[ ] args ) throws Exception {
      DefaultCategoryDataset line_chart_dataset = new DefaultCategoryDataset();
      line_chart_dataset.addValue( 15 , "schools" , "1970" );
      line_chart_dataset.addValue( 30 , "schools" , "1980" );
      line_chart_dataset.addValue( 60 , "schools" , "1990" );
      line_chart_dataset.addValue( 120 , "schools" , "2000" );
      line_chart_dataset.addValue( 240 , "schools" , "2010" );
      line_chart_dataset.addValue( 300 , "schools" , "2014" );

      JFreeChart lineChartObject = ChartFactory.createLineChart(
         "Schools Vs Years","Year",
         "Schools Count",
         line_chart_dataset,PlotOrientation.VERTICAL,
         true,true,false);

      int width = 640;    /* Width of the image */
      int height = 480;   /* Height of the image */
      File lineChart = new File( "LineChart.jpeg" );
      ChartUtilities.saveChartAsJPEG(lineChart ,lineChartObject, width ,height);
   }
}
Let us keep the above Java code in LineChart.java file, and then compile and run it from the command prompted as −
$javac LineChart.java
$java LineChart
If everything is fine, it will compile and execute to create a JPEG image file named LineChart.jpeg in your current directory.
JFreeChart - XY Chart
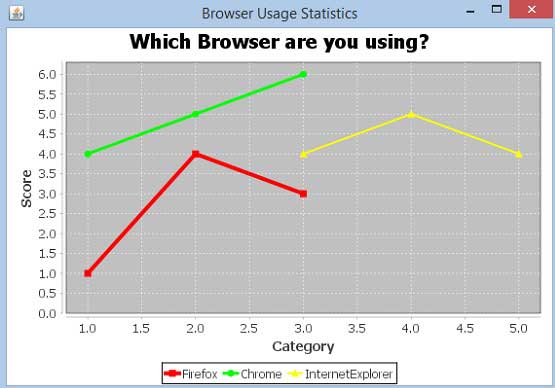
The XY chart (scatter) is based on one data series consisting of a list of X and Y values. Each value pair (X,Y) is a point in a coordinate system. Here, one value determines the horizontal (X) position, and the other determines the vertical (Y) position. This chapter demonstrates how we can use JFreeChart to create XY Chart from a given set of business data.
Business Data
Consider an example where we want to create an XY chart for all major browsers. Here, different performance scores are gathered from different categories of people as shown below −
| Firefox | Category(X) | Score(Y) |
|---|---|---|
| 1.0 | 1.0 | |
| 2.0 | 4.0 | |
| 3.0 | 3.0 | |
| Chrome | Category(X) | Score(Y) |
| 1.0 | 4.0 | |
| 2.0 | 5.0 | |
| 3.0 | 6.0 | |
| IE | Category(X) | Score(Y) |
| 3.0 | 4.0 | |
| 4.0 | 5.0 | |
| 5.0 | 4.0 |
AWT Based Application
Following is the code to create an XY Chart from the above given information. This code helps you to embed an XY chart in any AWT based application.
import java.awt.Color;
import java.awt.BasicStroke;

import org.jfree.chart.ChartPanel;
import org.jfree.chart.JFreeChart;
import org.jfree.data.xy.XYDataset;
import org.jfree.data.xy.XYSeries;
import org.jfree.ui.ApplicationFrame;
import org.jfree.ui.RefineryUtilities;
import org.jfree.chart.plot.XYPlot;
import org.jfree.chart.ChartFactory;
import org.jfree.chart.plot.PlotOrientation;
import org.jfree.data.xy.XYSeriesCollection;
import org.jfree.chart.renderer.xy.XYLineAndShapeRenderer;

public class XYLineChart_AWT extends ApplicationFrame {

   public XYLineChart_AWT( String applicationTitle, String chartTitle ) {
      super(applicationTitle);
      JFreeChart xylineChart = ChartFactory.createXYLineChart(
         chartTitle ,
         "Category" ,
         "Score" ,
         createDataset() ,
         PlotOrientation.VERTICAL ,
         true , true , false);

      ChartPanel chartPanel = new ChartPanel( xylineChart );
      chartPanel.setPreferredSize( new java.awt.Dimension( 560 , 367 ) );
      final XYPlot plot = xylineChart.getXYPlot( );

      XYLineAndShapeRenderer renderer = new XYLineAndShapeRenderer( );
      renderer.setSeriesPaint( 0 , Color.RED );
      renderer.setSeriesPaint( 1 , Color.GREEN );
      renderer.setSeriesPaint( 2 , Color.YELLOW );
      renderer.setSeriesStroke( 0 , new BasicStroke( 4.0f ) );
      renderer.setSeriesStroke( 1 , new BasicStroke( 3.0f ) );
      renderer.setSeriesStroke( 2 , new BasicStroke( 2.0f ) );
      plot.setRenderer( renderer );
      setContentPane( chartPanel );
   }

   private XYDataset createDataset( ) {
      final XYSeries firefox = new XYSeries( "Firefox" );
      firefox.add( 1.0 , 1.0 );
      firefox.add( 2.0 , 4.0 );
      firefox.add( 3.0 , 3.0 );

      final XYSeries chrome = new XYSeries( "Chrome" );
      chrome.add( 1.0 , 4.0 );
      chrome.add( 2.0 , 5.0 );
      chrome.add( 3.0 , 6.0 );

      final XYSeries iexplorer = new XYSeries( "InternetExplorer" );
      iexplorer.add( 3.0 , 4.0 );
      iexplorer.add( 4.0 , 5.0 );
      iexplorer.add( 5.0 , 4.0 );

      final XYSeriesCollection dataset = new XYSeriesCollection( );
      dataset.addSeries( firefox );
      dataset.addSeries( chrome );
      dataset.addSeries( iexplorer );
      return dataset;
   }

   public static void main( String[ ] args ) {
      XYLineChart_AWT chart = new XYLineChart_AWT("Browser Usage Statistics",
         "Which Browser are you using?");
      chart.pack( );
      RefineryUtilities.centerFrameOnScreen( chart );
      chart.setVisible( true );
   }
}
Let us keep the above Java code in XYLineChart_AWT.java file, and then compile and run it from the command prompted as:
$javac XYLineChart_AWT.java
$java XYLineChart_AWT
If everything is fine, it will compile and run to generate the following XY Graph −
JPEG Image Creation
Let us re-write the above example to generate a JPEG image from the command line.
import java.io.*;

import org.jfree.chart.ChartFactory;
import org.jfree.chart.JFreeChart;
import org.jfree.data.xy.XYSeries;
import org.jfree.chart.plot.PlotOrientation;
import org.jfree.data.xy.XYSeriesCollection;
import org.jfree.chart.ChartUtilities;

public class XYLineChart_image {

   public static void main( String[ ] args )throws Exception {
      final XYSeries firefox = new XYSeries( "Firefox" );
      firefox.add( 1.0 , 1.0 );
      firefox.add( 2.0 , 4.0 );
      firefox.add( 3.0 , 3.0 );

      final XYSeries chrome = new XYSeries( "Chrome" );
      chrome.add( 1.0 , 4.0 );
      chrome.add( 2.0 , 5.0 );
      chrome.add( 3.0 , 6.0 );

      final XYSeries iexplorer = new XYSeries( "InternetExplorer" );
      iexplorer.add( 3.0 , 4.0 );
      iexplorer.add( 4.0 , 5.0 );
      iexplorer.add( 5.0 , 4.0 );

      final XYSeriesCollection dataset = new XYSeriesCollection( );
      dataset.addSeries( firefox );
      dataset.addSeries( chrome );
      dataset.addSeries( iexplorer );

      JFreeChart xylineChart = ChartFactory.createXYLineChart(
         "Browser usage statastics",
         "Category",
         "Score",
         dataset,
         PlotOrientation.VERTICAL,
         true, true, false);

      int width = 640;   /* Width of the image */
      int height = 480;  /* Height of the image */
      File XYChart = new File( "XYLineChart.jpeg" );
      ChartUtilities.saveChartAsJPEG( XYChart, xylineChart, width, height);
   }
}
Let us keep the above Java code in XYLineChart_image.java file, and then compile and run it from the command prompted as −
$javac XYLineChart_image.java
$java XYLineChart_image
If everything is fine, it will compile and run to create a JPEG image file named XYLineChart.jpeg in your current directory.
JFreeChart - 3D Pie/Bar Chart
The 3D charts are the ones, which appear in a three-dimensional format. You can use these charts to provide better display and clear information. A 3D Pie chart is same as the pie chart additionally with a nice 3D effect. A 3D effect can be achieved by adding a little extra code, which will take care of creating 3D effect in a pie chart.
3D Pie chart
Consider the following example to illustrate mobile sale with the help of a 3D pie chart. Following is a list of different mobile brands and their sale (units per day).
| S.No | Mobile Brands | Sales (UNITS per day) |
|---|---|---|
| 1 | Iphone 5S | 20 |
| 2 | Samsung Grand | 20 |
| 3 | MOTO G | 40 |
| 4 | Nokia Lumia | 10 |
Following is the code to create 3D Pie Chart from the above given information. This code helps you to embed a pie chart in any AWT based application.
import java.io.*;

import org.jfree.chart.ChartFactory;
import org.jfree.chart.JFreeChart;
import org.jfree.chart.plot.PiePlot3D;
import org.jfree.data.general.DefaultPieDataset;
import org.jfree.chart.ChartUtilities;

public class PieChart3D {

   public static void main( String[ ] args )throws Exception {
      DefaultPieDataset dataset = new DefaultPieDataset( );
      dataset.setValue( "IPhone 5s" , new Double( 20 ) );
      dataset.setValue( "SamSung Grand" , new Double( 20 ) );
      dataset.setValue( "MotoG" , new Double( 40 ) );
      dataset.setValue( "Nokia Lumia" , new Double( 10 ) );

      JFreeChart chart = ChartFactory.createPieChart3D(
         "Mobile Sales" ,  // chart title
         dataset ,         // data
         true ,            // include legend
         true,
         false);

      final PiePlot3D plot = ( PiePlot3D ) chart.getPlot( );
      plot.setStartAngle( 270 );
      plot.setForegroundAlpha( 0.60f );
      plot.setInteriorGap( 0.02 );
      int width = 640;   /* Width of the image */
      int height = 480;  /* Height of the image */
      File pieChart3D = new File( "pie_Chart3D.jpeg" );
      ChartUtilities.saveChartAsJPEG( pieChart3D , chart , width , height );
   }
}
Let us keep the above Java code in PieChart3D.java file, and then compile and run it from the command prompted as −
$javac PieChart3D.java
$java PieChart3D
If everything is fine, it will compile and run to create a JPEG image file named PieChart3D.jpeg having the following 3D Pie Chart −
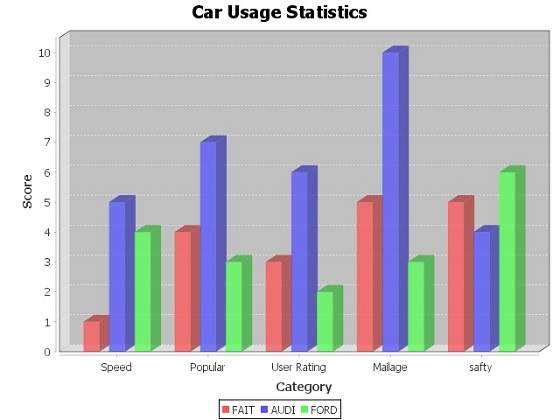
3D Bar Chart
A 3D Bar chart is same as the bar chart additionally with a nice 3D effect. A 3D effect can achieved by adding a little extra code, which will take care of creating 3D effect in a bar chart. Consider the following example that depicts various car statistics with the help of a 3D bar chart. Following is a list of car brands along with their different characteristics, which we will show using a bar chart −
| Car | Speed | User Rating | Millage | Safety |
|---|---|---|---|---|
| FIAT | 1.0 | 3.0 | 5.0 | 5.0 |
| AUDI | 5.0 | 6.0 | 10.0 | 4.0 |
| FORD | 4.0 | 2.0 | 3.0 | 6.0 |
The following code creates 3D Bar Chart from the above given information. This code helps you to embed a bar chart in any AWT based application.
import java.io.*;

import org.jfree.chart.ChartFactory;
import org.jfree.chart.JFreeChart;
import org.jfree.chart.plot.PlotOrientation;
import org.jfree.data.category.DefaultCategoryDataset;
import org.jfree.chart.ChartUtilities;

public class BarChart3D {

   public static void main( String[ ] args )throws Exception {
      final String fait = "FAIT";
      final String audi = "AUDI";
      final String ford = "FORD";
      final String speed = "Speed";
      final String popular = "Popular";
      final String mailage = "Mailage";
      final String userrating = "User Rating";
      final String safety = "safety";
      final DefaultCategoryDataset dataset = new DefaultCategoryDataset( );

      dataset.addValue( 1.0 , fait , speed );
      dataset.addValue( 4.0 , fait , popular );
      dataset.addValue( 3.0 , fait , userrating );
      dataset.addValue( 5.0 , fait , mailage );
      dataset.addValue( 5.0 , fait , safety );

      dataset.addValue( 5.0 , audi , speed );
      dataset.addValue( 7.0 , audi , popular );
      dataset.addValue( 6.0 , audi , userrating );
      dataset.addValue( 10.0 , audi , mailage );
      dataset.addValue( 4.0 , audi , safety );

      dataset.addValue( 4.0 , ford , speed );
      dataset.addValue( 3.0 , ford , popular );
      dataset.addValue( 2.0 , ford , userrating );
      dataset.addValue( 3.0 , ford , mailage );
      dataset.addValue( 6.0 , ford , safety );

      JFreeChart barChart = ChartFactory.createBarChart3D(
         "Car Usage Statistics",
         "Category",
         "Score",
         dataset,
         PlotOrientation.VERTICAL,
         true, true, false);

      int width = 640; /* Width of the image */
      int height = 480; /* Height of the image */
      File barChart3D = new File( "barChart3D.jpeg" );
      ChartUtilities.saveChartAsJPEG( barChart3D, barChart, width, height);
   }
}
Let us keep the above Java code in BarChart3D.java file, and then compile and run it from the command prompted as −
$javac BarChart3D.java
$java BarChart3
If everything is fine with your environment, it will compile and run to create a JPEG image file BarChart3D.jpeg having the following 3D Bar Chart −
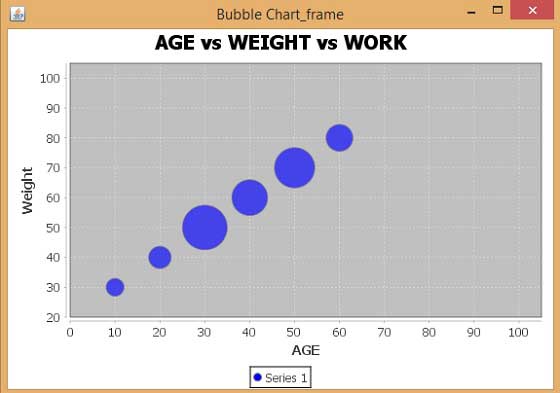
JFreeChart - Bubble Chart
This chapter demonstrates how you can use JFreeChart to create Bubble Chart from a given set of business data. A bubble chart displays information in three-dimensional way. A bubble is plotted at the place where (x, y) coordinate intersect. The size of the bubble is considered as range or quantity of X and Y axis.
Business Data
Let us consider different persons along with their age, weight, and work capacities. The wok capacity can be treated as number of hours that is plotted as bubbles in the chart.
| WEIGHT | ||||||||
|---|---|---|---|---|---|---|---|---|
| AGE | 30 | 40 | 50 | 60 | 70 | 80 | ||
| 10 | 4 | WORK | ||||||
| 20 | 5 | |||||||
| 30 | 10 | |||||||
| 40 | 8 | |||||||
| 50 | 9 | |||||||
| 60 | 6 | |||||||
AWT Based Application
Following is the code to create Bubble Chart from the above given information. This code helps you to embed a Bubble chart in any AWT based application.
import java.awt.Color;
import java.awt.Dimension;

import javax.swing.JPanel;

import org.jfree.chart.*;
import org.jfree.chart.axis.NumberAxis;
import org.jfree.chart.plot.PlotOrientation;
import org.jfree.chart.plot.XYPlot;
import org.jfree.chart.renderer.xy.XYItemRenderer;
import org.jfree.data.xy.DefaultXYZDataset;
import org.jfree.data.xy.XYZDataset;
import org.jfree.ui.ApplicationFrame;
import org.jfree.ui.RefineryUtilities;

public class BubbleChart_AWT extends ApplicationFrame {

   public BubbleChart_AWT( String s ) {
      super( s );
      JPanel jpanel = createDemoPanel( );
      jpanel.setPreferredSize(new Dimension( 560 , 370 ) );
      setContentPane( jpanel );
   }

   private static JFreeChart createChart( XYZDataset xyzdataset ) {
      JFreeChart jfreechart = ChartFactory.createBubbleChart(
         "AGE vs WEIGHT vs WORK",
         "Weight",
         "AGE",
         xyzdataset,
         PlotOrientation.HORIZONTAL,
         true, true, false);

      XYPlot xyplot = ( XYPlot )jfreechart.getPlot( );
      xyplot.setForegroundAlpha( 0.65F );
      XYItemRenderer xyitemrenderer = xyplot.getRenderer( );
      xyitemrenderer.setSeriesPaint( 0 , Color.blue );
      NumberAxis numberaxis = ( NumberAxis )xyplot.getDomainAxis( );
      numberaxis.setLowerMargin( 0.2 );
      numberaxis.setUpperMargin( 0.5 );
      NumberAxis numberaxis1 = ( NumberAxis )xyplot.getRangeAxis( );
      numberaxis1.setLowerMargin( 0.8 );
      numberaxis1.setUpperMargin( 0.9 );

      return jfreechart;
   }

   public static XYZDataset createDataset( ) {
      DefaultXYZDataset defaultxyzdataset = new DefaultXYZDataset();
      double ad[ ] = { 30 , 40 , 50 , 60 , 70 , 80 };
      double ad1[ ] = { 10 , 20 , 30 , 40 , 50 , 60 };
      double ad2[ ] = { 4 , 5 , 10 , 8 , 9 , 6 };
      double ad3[][] = { ad , ad1 , ad2 };
      defaultxyzdataset.addSeries( "Series 1" , ad3 );

      return defaultxyzdataset;
   }

   public static JPanel createDemoPanel( ) {
      JFreeChart jfreechart = createChart( createDataset( ) );
      ChartPanel chartpanel = new ChartPanel( jfreechart );

      chartpanel.setDomainZoomable( true );
      chartpanel.setRangeZoomable( true );

      return chartpanel;
   }

   public static void main( String args[ ] ) {
      BubbleChart_AWT bubblechart = new BubbleChart_AWT( "Bubble Chart_frame" );
      bubblechart.pack( );
      RefineryUtilities.centerFrameOnScreen( bubblechart );
      bubblechart.setVisible( true );
   }
}
Let us keep the above Java code in BubbleChart_AWT.java file, and then compile and run it from the command prompted as −
$javac BubbleChart_AWT.java
$java BubbleChart_AW
If everything is fine, it will compile and run to generate the following Bubble Graph −
JPEG Image Creation
Let us re-write the above example to generate a JPEG image from a command line.
import java.io.*;

import java.awt.Color;

import org.jfree.chart.*;
import org.jfree.chart.axis.NumberAxis;
import org.jfree.chart.plot.PlotOrientation;
import org.jfree.chart.plot.XYPlot;
import org.jfree.chart.renderer.xy.XYItemRenderer;
import org.jfree.data.xy.DefaultXYZDataset;
import org.jfree.chart.ChartUtilities;

public class BubbleChart_image {

   public static void main( String args[ ] )throws Exception {
      DefaultXYZDataset defaultxyzdataset = new DefaultXYZDataset( );
      double ad[ ] = { 30 , 40 , 50 , 60 , 70 , 80 };
      double ad1[ ] = { 10 , 20 , 30 , 40 , 50 , 60 };
      double ad2[ ] = { 4 , 5 , 10 , 8 , 9 , 6 };
      double ad3[ ][ ] = { ad , ad1 , ad2 };
      defaultxyzdataset.addSeries( "Series 1" , ad3 );

      JFreeChart jfreechart = ChartFactory.createBubbleChart(
         "AGE vs WEIGHT vs WORK",
         "Weight",
         "AGE",
         defaultxyzdataset,
         PlotOrientation.HORIZONTAL,
         true, true, false);

      XYPlot xyplot = ( XYPlot )jfreechart.getPlot( );
      xyplot.setForegroundAlpha( 0.65F );
      XYItemRenderer xyitemrenderer = xyplot.getRenderer( );
      xyitemrenderer.setSeriesPaint( 0 , Color.blue );
      NumberAxis numberaxis = ( NumberAxis )xyplot.getDomainAxis( );
      numberaxis.setLowerMargin( 0.2 );
      numberaxis.setUpperMargin( 0.5 );
      NumberAxis numberaxis1 = ( NumberAxis )xyplot.getRangeAxis( );
      numberaxis1.setLowerMargin( 0.8 );
      numberaxis1.setUpperMargin( 0.9 );

      int width = 560;   /* Width of the image */
      int height = 370;  /* Height of the image */
      File bubbleChart = new File("BubbleChart.jpeg");
      ChartUtilities.saveChartAsJPEG(bubbleChart,jfreechart,width,height);
   }
}
Let us keep the above Java code in BubbleChart_image.java file, and then compile and run it from the command prompted as −
$javac BubbleChart_image.java
$java BubbleChart_image
If everything is fine, it will compile and run to create a JPEG image file named BubbleChart.jpeg in your current directory.
JFreeChart - TimeSeries Chart
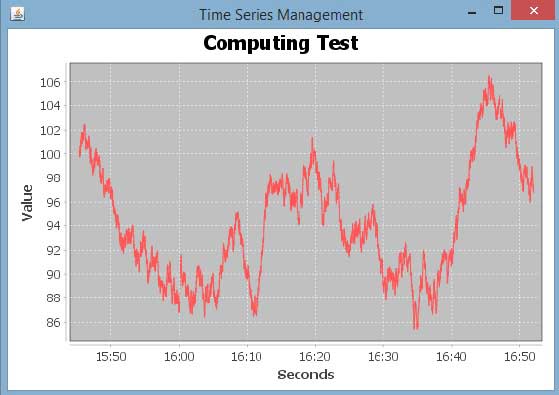
A time series chart displays sequence of data points, which varies at equal intervals of time. This chapter demonstrates how we can use JFreeChart to create Time Series Chart from a given set of business data.
Business Data
Let us consider various random numbers generated by using standard Java API Math.random(). We use these numbers to generate a Time Series Chart. You can generate similar chart for total number of errors occurring in your website at a given interval of time.
AWT Based Application
Following is the code to create Time Series Chart from the numbers generated by Math.random() at a given time internal.
import org.jfree.chart.ChartFactory;
import org.jfree.chart.ChartPanel;
import org.jfree.chart.JFreeChart;
import org.jfree.data.general.SeriesException;
import org.jfree.data.time.Second;
import org.jfree.data.time.TimeSeries;
import org.jfree.data.time.TimeSeriesCollection;
import org.jfree.data.xy.XYDataset;
import org.jfree.ui.ApplicationFrame;
import org.jfree.ui.RefineryUtilities;

public class TimeSeries_AWT extends ApplicationFrame {

   public TimeSeries_AWT( final String title ) {
      super( title );
      final XYDataset dataset = createDataset( );
      final JFreeChart chart = createChart( dataset );
      final ChartPanel chartPanel = new ChartPanel( chart );
      chartPanel.setPreferredSize( new java.awt.Dimension( 560 , 370 ) );
      chartPanel.setMouseZoomable( true , false );
      setContentPane( chartPanel );
   }

   private XYDataset createDataset( ) {
      final TimeSeries series = new TimeSeries( "Random Data" );
      Second current = new Second( );
      double value = 100.0;

      for (int i = 0; i < 4000; i++) {

         try {
            value = value + Math.random( ) - 0.5;
            series.add(current, new Double( value ) );
            current = ( Second ) current.next( );
         } catch ( SeriesException e ) {
            System.err.println("Error adding to series");
         }
      }

      return new TimeSeriesCollection(series);
   }

   private JFreeChart createChart( final XYDataset dataset ) {
      return ChartFactory.createTimeSeriesChart(
         "Computing Test",
         "Seconds",
         "Value",
         dataset,
         false,
         false,
         false);
   }

   public static void main( final String[ ] args ) {
      final String title = "Time Series Management";
      final TimeSeries_AWT demo = new TimeSeries_AWT( title );
      demo.pack( );
      RefineryUtilities.positionFrameRandomly( demo );
      demo.setVisible( true );
   }
}
Let us keep the above Java code in TimeSeries_AWT.java file, and then compile and run it from the command prompted as −
$javac TimeSeries_AWT.java
$java TImeSeries_AWT
If everything is fine, it will compile and run to generate the following Time Series Graph −
JPEG Image Creation
Let us re-write the above example to generate a JPEG image from a command line.
import java.io.*;

import org.jfree.chart.ChartFactory;
import org.jfree.chart.JFreeChart;
import org.jfree.data.general.SeriesException;
import org.jfree.data.time.Second;
import org.jfree.data.time.TimeSeries;
import org.jfree.data.time.TimeSeriesCollection;
import org.jfree.data.xy.XYDataset;
import org.jfree.chart.ChartUtilities;

public class TimeSeriesChart {

   public static void main( final String[ ] args )throws Exception {
      final TimeSeries series = new TimeSeries( "Random Data" );
      Second current = new Second();
      double value = 100.0;

      for ( int i = 0 ; i < 4000 ; i++ ) {

         try {
            value = value + Math.random( ) - 0.5;
            series.add( current , new Double( value ) );
            current = ( Second ) current.next( );
         } catch ( SeriesException e ) {
            System.err.println( "Error adding to series" );
         }
      }

      final XYDataset dataset=( XYDataset )new TimeSeriesCollection(series);
      JFreeChart timechart = ChartFactory.createTimeSeriesChart(
         "Computing Test",
         "Seconds",
         "Value",
         dataset,
         false,
         false,
         false);

      int width = 560;   /* Width of the image */
      int height = 370;  /* Height of the image */
      File timeChart = new File( "TimeChart.jpeg" );
      ChartUtilities.saveChartAsJPEG( timeChart, timechart, width, height );
   }
}
Let us keep the above Java code in TimeSeriesChart.java file, and then compile and run it from the command prompted as −
$javac TimeSeriesChart.java
$java TimeSeriesChart
If everything is fine with your environment, it will compile and run to create a JPEG image file TimeChart.jpeg file in your current directory.
JFreeChart - File Interface
So far we studied how to create various types of charts using JFreeChart APIs using static data. But in production environment, data is provided in the form of text file with a predefined format, or it comes directly from the database.
This chapter will explain how we can read a simple data from a given text file from a given location and then use JFreeChart to create a chart of your choice.
Business Data
Consider we have a file named mobile.txt, having different mobile brands and their sale (units per day) separated by a simple comma (,) −
Iphone 5S, 20
Samsung Grand, 20
MOTO G, 40  Nokia
Lumia, 10
Chart Generation Based on File
Following is the code to create a Pie Chart based on the information provided in mobile.txt −
import java.io.*;

import java.util.StringTokenizer;

import org.jfree.chart.ChartUtilities;
import org.jfree.chart.ChartFactory;
import org.jfree.chart.JFreeChart;
import org.jfree.data.general.DefaultPieDataset;

public class PieChart_File {

   public static void main( String[ ] args )throws Exception {

      String mobilebrands[ ] = {
         "IPhone 5s" ,
         "SamSung Grand" ,
         "MotoG" ,
         "Nokia Lumia"
      };

      InputStream in = new FileInputStream( new File( "C:/temp/test.txt" ) );
      BufferedReader reader = new BufferedReader(new InputStreamReader(in ) );
      StringBuilder out = new StringBuilder();
      String line;
      DefaultPieDataset dataset = new DefaultPieDataset();

      while (( line = reader.readLine() ) != null ) {
         out.append( line );
      }

      StringTokenizer s = new StringTokenizer( out.toString(), "," );
      int i = 0;

      while( s.hasMoreTokens( ) && ( mobilebrands [i] != null ) ) {
         dataset.setValue(mobilebrands[i], Double.parseDouble( s.nextToken( ) ));
         i++;
      }

      JFreeChart chart = ChartFactory.createPieChart(
         "Mobile Sales",    // chart title
         dataset,           // data
         true,              // include legend
         true,
         false);

      int width = 560;    /* Width of the image */
      int height = 370;   /* Height of the image */
      File pieChart = new File( "pie_Chart.jpeg" );
      ChartUtilities.saveChartAsJPEG( pieChart, chart, width, height);
   }
}
Let us keep the above Java code in PieChart_File.java file, and then compile and run it from the command prompted as −
$javac PieChart_File.java
$java PieChart_File
If everything is fine, it will compile and run to create a JPEG image file named PieChart.jpeg that contains the following chart.

JFreeChart - Database Interface
This chapter explains how you can read simple data from a database table and then use JFreeChart to create a chart of your choice.
Business Data
Consider we have the following MySQL table mobile_tbl(mobile_brand VARCHAR(100) NOT NULL, unit_sale INT NO NULL);
Consider this table is having the following records −
| Mobile Brands | Unit Sales |
|---|---|
| IPhone5S | 20 |
| Samsung Grand | 20 |
| MotoG | 40 |
| Nokia Lumia | 10 |
Chart Generation Using Database
Following is the code to create a Pie Chart based on the information provided in mobile_tbl table available in test_db in a MySQL database. Based on your requirements, you can use any other database.
import java.io.*;
import java.sql.*;

import org.jfree.chart.ChartUtilities;
import org.jfree.chart.ChartFactory;
import org.jfree.chart.JFreeChart;
import org.jfree.data.general.DefaultPieDataset;

public class PieChart_DB {

   public static void main( String[ ] args )throws Exception {

      String mobilebrands[] = {
         "IPhone 5s",
         "SamSung Grand",
         "MotoG",
         "Nokia Lumia"
      };

      /* Create MySQL Database Connection */
      Class.forName( "com.mysql.jdbc.Driver" );
      Connection connect = DriverManager.getConnection(
         "jdbc:mysql://localhost:3306/jf_testdb" ,
         "root",
         "root123");

      Statement statement = connect.createStatement( );
      ResultSet resultSet = statement.executeQuery("select * from mobile_data" );
      DefaultPieDataset dataset = new DefaultPieDataset( );

      while( resultSet.next( ) ) {
         dataset.setValue(
         resultSet.getString( "mobile_brand" ) ,
         Double.parseDouble( resultSet.getString( "unit_sale" )));
      }

      JFreeChart chart = ChartFactory.createPieChart(
         "Mobile Sales",   // chart title
         dataset,          // data
         true,             // include legend
         true,
         false );

      int width = 560;    /* Width of the image */
      int height = 370;   /* Height of the image */
      File pieChart = new File( "Pie_Chart.jpeg" );
      ChartUtilities.saveChartAsJPEG( pieChart , chart , width , height );
   }
}
Let us keep the above Java code in PieChart_DB.java file, and then compile and run it from the command prompted as −
$javac PieChart_DB.java
$java PieChart_DB
If everything is fine, it will compile and run to create a JPEG image file named Pie_Chart.jpeg having the following chart.