- JFreeChart - Home
- JFreeChart - Overview
- JFreeChart - Installation
- JFreeChart - Architecture
- JFreeChart - Referenced APIs
- JFreeChart - Pie Chart
- JFreeChart - Bar Chart
- JFreeChart - Line Chart
- JFreeChart - XY Chart
- JFreeChart - 3D Chart/Bar Chart
- JFreeChart- Bubble Chart
- JFreeChart - TimeSeries Chart
- JFreeChart - File Interface
- JFreeChart - Database Interface
JFreeChart - Bar Chart
This chapter demonstrates how you can use JFreeChart to create Bar Chart from a given set of business data.
A bar chart uses different orientation (horizontal or vertical) bars to show comparisons in various categories. One axis (domain axis) of the chart shows the specific domain being compared, and the other axis (range axis) represents discrete values.
Business Data
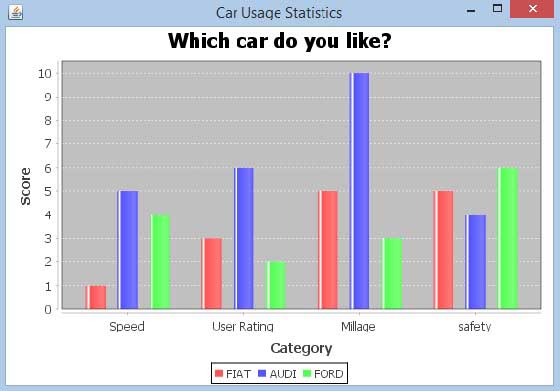
The following example depicts various car statistics with the help of a bar chart. Following is a list of car brands along with their different characteristics, which we will show using a bar chart −
| Car | Speed | User Rating | Millage | Safety |
|---|---|---|---|---|
| Fiat | 1.0 | 3.0 | 5.0 | 5.0 |
| Audi | 5.0 | 6.0 | 10.0 | 4.0 |
| Ford | 4.0 | 2.0 | 3.0 | 6.0 |
AWT Based Application
Following is the code to create a Bar Chart from the above given information. This code helps you to embed a bar chart in any AWT based application.
import org.jfree.chart.ChartFactory;
import org.jfree.chart.ChartPanel;
import org.jfree.chart.JFreeChart;
import org.jfree.chart.plot.PlotOrientation;
import org.jfree.data.category.CategoryDataset;
import org.jfree.data.category.DefaultCategoryDataset;
import org.jfree.ui.ApplicationFrame;
import org.jfree.ui.RefineryUtilities;

public class BarChart_AWT extends ApplicationFrame {

   public BarChart_AWT( String applicationTitle , String chartTitle ) {
      super( applicationTitle );
      JFreeChart barChart = ChartFactory.createBarChart(
         chartTitle,
         "Category",
         "Score",
         createDataset(),
         PlotOrientation.VERTICAL,
         true, true, false);

      ChartPanel chartPanel = new ChartPanel( barChart );
      chartPanel.setPreferredSize(new java.awt.Dimension( 560 , 367 ) );
      setContentPane( chartPanel );
   }

   private CategoryDataset createDataset( ) {
      final String fiat = "FIAT";
      final String audi = "AUDI";
      final String ford = "FORD";
      final String speed = "Speed";
      final String millage = "Millage";
      final String userrating = "User Rating";
      final String safety = "safety";
      final DefaultCategoryDataset dataset =
      new DefaultCategoryDataset( );

      dataset.addValue( 1.0 , fiat , speed );
      dataset.addValue( 3.0 , fiat , userrating );
      dataset.addValue( 5.0 , fiat , millage );
      dataset.addValue( 5.0 , fiat , safety );

      dataset.addValue( 5.0 , audi , speed );
      dataset.addValue( 6.0 , audi , userrating );
      dataset.addValue( 10.0 , audi , millage );
      dataset.addValue( 4.0 , audi , safety );

      dataset.addValue( 4.0 , ford , speed );
      dataset.addValue( 2.0 , ford , userrating );
      dataset.addValue( 3.0 , ford , millage );
      dataset.addValue( 6.0 , ford , safety );

      return dataset;
   }

   public static void main( String[ ] args ) {
      BarChart_AWT chart = new BarChart_AWT("Car Usage Statistics",
         "Which car do you like?");
      chart.pack( );
      RefineryUtilities.centerFrameOnScreen( chart );
      chart.setVisible( true );
   }
}
Let us keep the above Java code in BarChart_AWT.java file, and then compile and run it from the command prompted as −
$javac BarChar_AWT.java
$java BarChart_AWT
If everything is fine, it will compile and run to generate the following Bar Graph −
JPEG Image Creation
Let us re-write the above example to generate a JPEG image from a command line.
import java.io.*;

import org.jfree.chart.ChartFactory;
import org.jfree.chart.JFreeChart;
import org.jfree.chart.plot.PlotOrientation;
import org.jfree.data.category.DefaultCategoryDataset;
import org.jfree.chart.ChartUtilities;

public class BarChart {

   public static void main( String[ ] args )throws Exception {
      final String fiat = "FIAT";
      final String audi = "AUDI";
      final String ford = "FORD";
      final String speed = "Speed";
      final String millage = "Millage";
      final String userrating = "User Rating";
      final String safety = "safety";

      final DefaultCategoryDataset dataset = new DefaultCategoryDataset( );
      dataset.addValue( 1.0 , fiat , speed );
      dataset.addValue( 3.0 , fiat , userrating );
      dataset.addValue( 5.0 , fiat , millage );
      dataset.addValue( 5.0 , fiat , safety );

      dataset.addValue( 5.0 , audi , speed );
      dataset.addValue( 6.0 , audi , userrating );
      dataset.addValue( 10.0 , audi , millage );
      dataset.addValue( 4.0 , audi , safety );

      dataset.addValue( 4.0 , ford , speed );
      dataset.addValue( 2.0 , ford , userrating );
      dataset.addValue( 3.0 , ford , millage );
      dataset.addValue( 6.0 , ford , safety );

      JFreeChart barChart = ChartFactory.createBarChart(
         "CAR USAGE STATIStICS",
         "Category", "Score",
         dataset,PlotOrientation.VERTICAL,
         true, true, false);

      int width = 640;    /* Width of the image */
      int height = 480;   /* Height of the image */
      File BarChart = new File( "BarChart.jpeg" );
      ChartUtilities.saveChartAsJPEG( BarChart , barChart , width , height );
   }
}
Let us keep the above Java code in BarChart.java file, and then compile and run it from the command prompted as −
$javac BarChart.java
$java BarChart
If everything is fine, it will compile and run to create a JPEG image file named BarChart.jpeg in your current directory.
