- JFreeChart - Home
- JFreeChart - Overview
- JFreeChart - Installation
- JFreeChart - Architecture
- JFreeChart - Referenced APIs
- JFreeChart - Pie Chart
- JFreeChart - Bar Chart
- JFreeChart - Line Chart
- JFreeChart - XY Chart
- JFreeChart - 3D Chart/Bar Chart
- JFreeChart- Bubble Chart
- JFreeChart - TimeSeries Chart
- JFreeChart - File Interface
- JFreeChart - Database Interface
JFreeChart - 3D Pie/Bar Chart
The 3D charts are the ones, which appear in a three-dimensional format. You can use these charts to provide better display and clear information. A 3D Pie chart is same as the pie chart additionally with a nice 3D effect. A 3D effect can be achieved by adding a little extra code, which will take care of creating 3D effect in a pie chart.
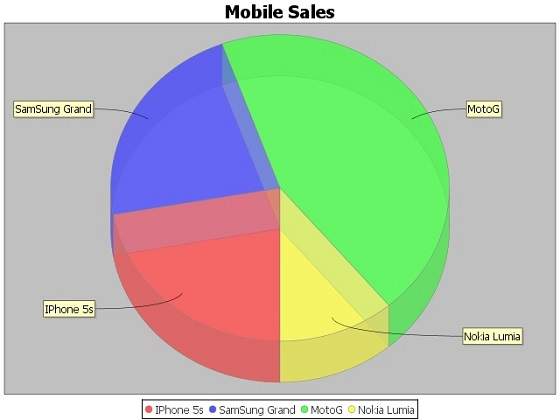
3D Pie chart
Consider the following example to illustrate mobile sale with the help of a 3D pie chart. Following is a list of different mobile brands and their sale (units per day).
| S.No | Mobile Brands | Sales (UNITS per day) |
|---|---|---|
| 1 | Iphone 5S | 20 |
| 2 | Samsung Grand | 20 |
| 3 | MOTO G | 40 |
| 4 | Nokia Lumia | 10 |
Following is the code to create 3D Pie Chart from the above given information. This code helps you to embed a pie chart in any AWT based application.
import java.io.*;

import org.jfree.chart.ChartFactory;
import org.jfree.chart.JFreeChart;
import org.jfree.chart.plot.PiePlot3D;
import org.jfree.data.general.DefaultPieDataset;
import org.jfree.chart.ChartUtilities;

public class PieChart3D {

   public static void main( String[ ] args )throws Exception {
      DefaultPieDataset dataset = new DefaultPieDataset( );
      dataset.setValue( "IPhone 5s" , new Double( 20 ) );
      dataset.setValue( "SamSung Grand" , new Double( 20 ) );
      dataset.setValue( "MotoG" , new Double( 40 ) );
      dataset.setValue( "Nokia Lumia" , new Double( 10 ) );

      JFreeChart chart = ChartFactory.createPieChart3D(
         "Mobile Sales" ,  // chart title
         dataset ,         // data
         true ,            // include legend
         true,
         false);

      final PiePlot3D plot = ( PiePlot3D ) chart.getPlot( );
      plot.setStartAngle( 270 );
      plot.setForegroundAlpha( 0.60f );
      plot.setInteriorGap( 0.02 );
      int width = 640;   /* Width of the image */
      int height = 480;  /* Height of the image */
      File pieChart3D = new File( "pie_Chart3D.jpeg" );
      ChartUtilities.saveChartAsJPEG( pieChart3D , chart , width , height );
   }
}
Let us keep the above Java code in PieChart3D.java file, and then compile and run it from the command prompted as −
$javac PieChart3D.java
$java PieChart3D
If everything is fine, it will compile and run to create a JPEG image file named PieChart3D.jpeg having the following 3D Pie Chart −
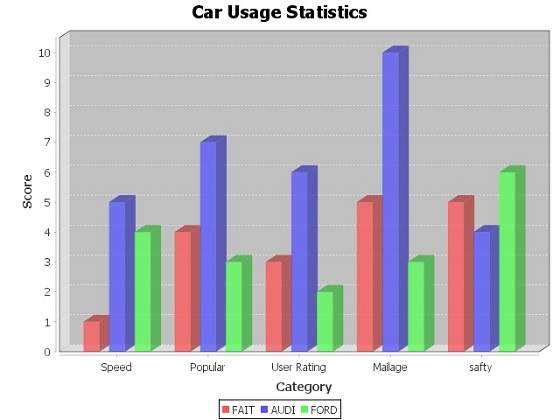
3D Bar Chart
A 3D Bar chart is same as the bar chart additionally with a nice 3D effect. A 3D effect can achieved by adding a little extra code, which will take care of creating 3D effect in a bar chart. Consider the following example that depicts various car statistics with the help of a 3D bar chart. Following is a list of car brands along with their different characteristics, which we will show using a bar chart −
| Car | Speed | User Rating | Millage | Safety |
|---|---|---|---|---|
| FIAT | 1.0 | 3.0 | 5.0 | 5.0 |
| AUDI | 5.0 | 6.0 | 10.0 | 4.0 |
| FORD | 4.0 | 2.0 | 3.0 | 6.0 |
The following code creates 3D Bar Chart from the above given information. This code helps you to embed a bar chart in any AWT based application.
import java.io.*;

import org.jfree.chart.ChartFactory;
import org.jfree.chart.JFreeChart;
import org.jfree.chart.plot.PlotOrientation;
import org.jfree.data.category.DefaultCategoryDataset;
import org.jfree.chart.ChartUtilities;

public class BarChart3D {

   public static void main( String[ ] args )throws Exception {
      final String fait = "FAIT";
      final String audi = "AUDI";
      final String ford = "FORD";
      final String speed = "Speed";
      final String popular = "Popular";
      final String mailage = "Mailage";
      final String userrating = "User Rating";
      final String safety = "safety";
      final DefaultCategoryDataset dataset = new DefaultCategoryDataset( );

      dataset.addValue( 1.0 , fait , speed );
      dataset.addValue( 4.0 , fait , popular );
      dataset.addValue( 3.0 , fait , userrating );
      dataset.addValue( 5.0 , fait , mailage );
      dataset.addValue( 5.0 , fait , safety );

      dataset.addValue( 5.0 , audi , speed );
      dataset.addValue( 7.0 , audi , popular );
      dataset.addValue( 6.0 , audi , userrating );
      dataset.addValue( 10.0 , audi , mailage );
      dataset.addValue( 4.0 , audi , safety );

      dataset.addValue( 4.0 , ford , speed );
      dataset.addValue( 3.0 , ford , popular );
      dataset.addValue( 2.0 , ford , userrating );
      dataset.addValue( 3.0 , ford , mailage );
      dataset.addValue( 6.0 , ford , safety );

      JFreeChart barChart = ChartFactory.createBarChart3D(
         "Car Usage Statistics",
         "Category",
         "Score",
         dataset,
         PlotOrientation.VERTICAL,
         true, true, false);

      int width = 640; /* Width of the image */
      int height = 480; /* Height of the image */
      File barChart3D = new File( "barChart3D.jpeg" );
      ChartUtilities.saveChartAsJPEG( barChart3D, barChart, width, height);
   }
}
Let us keep the above Java code in BarChart3D.java file, and then compile and run it from the command prompted as −
$javac BarChart3D.java
$java BarChart3
If everything is fine with your environment, it will compile and run to create a JPEG image file BarChart3D.jpeg having the following 3D Bar Chart −