- JFreeChart - Home
- JFreeChart - Overview
- JFreeChart - Installation
- JFreeChart - Architecture
- JFreeChart - Referenced APIs
- JFreeChart - Pie Chart
- JFreeChart - Bar Chart
- JFreeChart - Line Chart
- JFreeChart - XY Chart
- JFreeChart - 3D Chart/Bar Chart
- JFreeChart- Bubble Chart
- JFreeChart - TimeSeries Chart
- JFreeChart - File Interface
- JFreeChart - Database Interface
JFreeChart - Line Chart
A line chart or line graph displays information as a series of data points (markers) connected by straight line segments. Line Chart shows how data changes at equal time frequency.
This chapter demonstrates how we can use JFreeChart to create Line Chart from a given set of business data.
Business Data
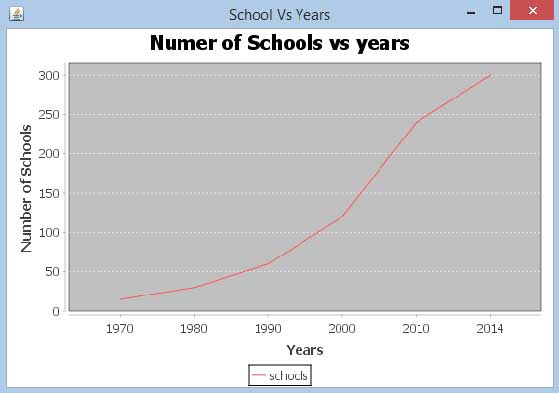
The following example draws a line chart to show a trend of number of schools opened in different years starting from 1970.
Given data is as follows −
| Year | Number OF Schools |
|---|---|
| 1970 | 15 |
| 1980 | 30 |
| 1990 | 60 |
| 2000 | 120 |
| 2013 | 240 |
| 2014 | 300 |
AWT Based Application
Following is the code to create Line Chart from the information above given. This code helps you to embed a line chart in any AWT based application.
import org.jfree.chart.ChartPanel;
import org.jfree.chart.ChartFactory;
import org.jfree.chart.JFreeChart;
import org.jfree.ui.ApplicationFrame;
import org.jfree.ui.RefineryUtilities;
import org.jfree.chart.plot.PlotOrientation;
import org.jfree.data.category.DefaultCategoryDataset;

public class LineChart_AWT extends ApplicationFrame {

   public LineChart_AWT( String applicationTitle , String chartTitle ) {
      super(applicationTitle);
      JFreeChart lineChart = ChartFactory.createLineChart(
         chartTitle,
         "Years","Number of Schools",
         createDataset(),
         PlotOrientation.VERTICAL,
         true,true,false);

      ChartPanel chartPanel = new ChartPanel( lineChart );
      chartPanel.setPreferredSize( new java.awt.Dimension( 560 , 367 ) );
      setContentPane( chartPanel );
   }

   private DefaultCategoryDataset createDataset( ) {
      DefaultCategoryDataset dataset = new DefaultCategoryDataset( );
      dataset.addValue( 15 , "schools" , "1970" );
      dataset.addValue( 30 , "schools" , "1980" );
      dataset.addValue( 60 , "schools" ,  "1990" );
      dataset.addValue( 120 , "schools" , "2000" );
      dataset.addValue( 240 , "schools" , "2010" );
      dataset.addValue( 300 , "schools" , "2014" );
      return dataset;
   }

   public static void main( String[ ] args ) {
      LineChart_AWT chart = new LineChart_AWT(
         "School Vs Years" ,
         "Numer of Schools vs years");

      chart.pack( );
      RefineryUtilities.centerFrameOnScreen( chart );
      chart.setVisible( true );
   }
}
Let us keep the above Java code in LineChart_AWT.java file, and then compile and run it from the command prompted as −
$javac LineChart_AWT.java
$java LineChart_AWT
If everything is fine, it will compile and run to generate the following Line Graph −
JPEG Image Creation
Let us re-write the above example to generate a JPEG image from a command line.
import java.io.*;

import org.jfree.chart.JFreeChart;
import org.jfree.chart.ChartFactory;
import org.jfree.chart.ChartUtilities;
import org.jfree.chart.plot.PlotOrientation;
import org.jfree.data.category.DefaultCategoryDataset;

public class LineChart {

   public static void main( String[ ] args ) throws Exception {
      DefaultCategoryDataset line_chart_dataset = new DefaultCategoryDataset();
      line_chart_dataset.addValue( 15 , "schools" , "1970" );
      line_chart_dataset.addValue( 30 , "schools" , "1980" );
      line_chart_dataset.addValue( 60 , "schools" , "1990" );
      line_chart_dataset.addValue( 120 , "schools" , "2000" );
      line_chart_dataset.addValue( 240 , "schools" , "2010" );
      line_chart_dataset.addValue( 300 , "schools" , "2014" );

      JFreeChart lineChartObject = ChartFactory.createLineChart(
         "Schools Vs Years","Year",
         "Schools Count",
         line_chart_dataset,PlotOrientation.VERTICAL,
         true,true,false);

      int width = 640;    /* Width of the image */
      int height = 480;   /* Height of the image */
      File lineChart = new File( "LineChart.jpeg" );
      ChartUtilities.saveChartAsJPEG(lineChart ,lineChartObject, width ,height);
   }
}
Let us keep the above Java code in LineChart.java file, and then compile and run it from the command prompted as −
$javac LineChart.java
$java LineChart
If everything is fine, it will compile and execute to create a JPEG image file named LineChart.jpeg in your current directory.
