
Article Categories
- All Categories
-
 Data Structure
-
 Networking
-
 RDBMS
RDBMS
-
 Operating System
-
 Java
Java
-
 MS Excel
-
 iOS
iOS
-
 HTML
HTML
-
 CSS
CSS
-
 Android
-
 Python
-
 C Programming
-
 C++
C++
-
 C#
C#
-
 MongoDB
-
 MySQL
MySQL
-
 Javascript
-
 PHP
PHP
-
 Economics & Finance
Implementing K-means clustering with SciPy by splitting random data in 2 clusters?
K-means clustering algorithm, also called flat clustering, is a method of computing the clusters and cluster centers (centroids) in a set of unlabeled data. It iterates until we find the optimal centroid. The clusters, we might think of a group of data points whose inter-point distances are small as compared to the distances to the point outside of that cluster. The number of clusters identified from unlabeled data is represented by ‘K’ in K-means algorithm.
Given an initial set of K centers, the K-means clustering algorithm can be done using SciPy library by executing by the following steps −
Step1− Data point normalization
Step2− Computing the Centroids which is referred to as code. Here, the 2-dimensional array of centroids is referred to as a code book.
Step3− Cluster formation and assigning the data points. It is referred to as mapping from the code book.
Example
#importing the required Python libraries :
import numpy as np
from numpy import vstack,array
from numpy.random import rand
from scipy.cluster.vq import whiten, kmeans, vq
from pylab import plot,show
#Random data generation :
data = vstack((rand(200,2) + array([.5,.5]),rand(150,2)))
#Normalizing the data :
data = whiten(data)
# computing K-Means with K = 2 (2 clusters)
centroids, mean_value = kmeans(data, 2)
print("Code book :<br>", centroids, "<br>")
print("Mean of Euclidean distances :", mean_value.round(4))
# mapping the centroids
clusters, _ = vq(data, centroids)
print("Cluster index :", clusters, "<br>")
#Plotting using numpy's logical indexing
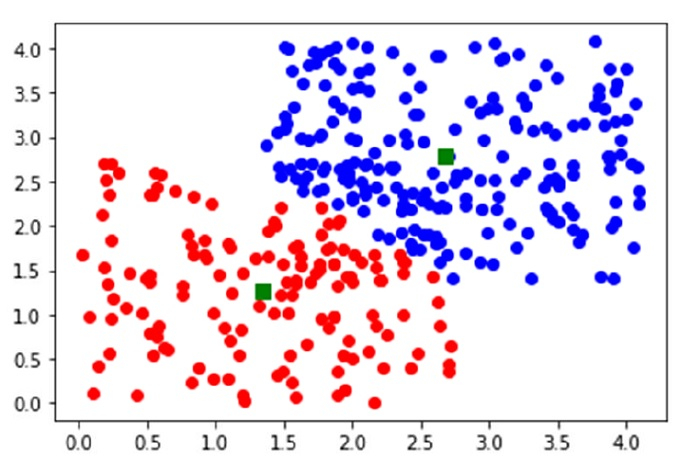
plot(data[clusters==0,0],data[clusters==0,1],'ob',data[clusters==1,0],data[clusters==1,1],'or')
plot(centroids[:,0],centroids[:,1],'sg',markersize=8)
show()
Output
Code book :
[[2.68379425 2.77892846]
[1.34079677 1.27029728]]


Mean of Euclidean distances : 0.9384

Cluster index : [0 1 0 0 0 0 0 0 1 0 0 0 0 0 0 0 0 0 0 0 0 0 0 0 0 0 0 0 0
0 0 1 0 0 1 1 0
0 0 0 0 0 0 0 0 1 0 0 0 1 0 0 0 0 0 1 0 0 0 0 0 0 0 0 0 0 0 0 0 0 1 0 0 1
0 0 0 0 0 0 0 0 0 0 0 0 1 0 0 1 0 0 0 0 0 0 0 0 0 0 0 0 0 0 1 0 1 0 0 0 0
0 0 0 0 0 0 0 0 0 0 0 0 0 0 1 1 0 0 0 0 1 0 0 1 0 0 0 0 0 0 0 0 0 1 0 0 0
0 0 0 0 0 0 0 0 0 0 0 0 0 0 0 0 1 0 0 1 0 0 0 0 0 0 0 0 0 0 0 0 0 0 0 1 0
0 0 0 0 0 0 0 0 0 0 0 1 0 0 0 1 0 0 1 0 1 0 1 1 1 1 0 1 1 1 1 0 1 1 1 1 1
1 0 1 1 1 1 1 1 1 1 1 1 1 1 1 0 1 0 1 1 1 1 1 1 1 1 1 1 1 0 1 1 1 1 0 1 1
1 1 1 1 1 1 1 0 1 1 1 0 1 0 1 1 1 1 1 0 1 0 1 1 1 0 1 0 1 1 1 1 1 1 1 1 0
1 1 1 1 1 0 1 1 0 0 0 1 1 1 1 1 1 1 1 1 1 1 0 1 1 0 0 1 1 0 0 1 0 1 1 1 1
1 1 0 1 1 1 1 1 1 0 1 1 0 1 1 1 0]

508 Views
