- OpenCV Python - Home
- OpenCV Python - Overview
- OpenCV Python - Environment
- OpenCV Python - Reading Image
- OpenCV Python - Write Image
- OpenCV Python - Using Matplotlib
- OpenCV Python - Image Properties
- OpenCV Python - Bitwise Operations
- OpenCV Python - Shapes and Text
- OpenCV Python - Mouse Events
- OpenCV Python - Add Trackbar
- OpenCV Python - Resize and Rotate
- OpenCV Python - Image Threshold
- OpenCV Python - Image Filtering
- OpenCV Python - Edge Detection
- OpenCV Python - Histogram
- OpenCV Python - Color Spaces
- OpenCV Python - Transformations
- OpenCV Python - Image Contours
- OpenCV Python - Template Matching
- OpenCV Python - Image Pyramids
- OpenCV Python - Image Addition
- OpenCV Python - Image Blending
- OpenCV Python - Fourier Transform
- OpenCV Python - Capture Videos
- OpenCV Python - Play Videos
- OpenCV Python - Images From Video
- OpenCV Python - Video from Images
- OpenCV Python - Face Detection
- OpenCV Python - Meanshift/Camshift
- OpenCV Python - Feature Detection
- OpenCV Python - Feature Matching
- OpenCV Python - Digit Recognition
- OpenCV Python Resources
- OpenCV Python - Quick Guide
- OpenCV Python - Resources
- OpenCV Python - Discussion
OpenCV Python - Digit Recognition with KNN
KNN which stands for K-Nearest Neighbour is a Machine Learning algorithm based on Supervised Learning. It tries to put a new data point into the category that is most similar to the available categories. All the available data is classified into distinct categories and a new data point is put in one of them based on the similarity.
The KNN algorithm works on following principle −
- Choose preferably an odd number as K for the number of neighbours to be checked.
- Calculate their Euclidean distance.
- Take the K nearest neighbors as per the calculated Euclidean distance.
- count the number of the data points in each category.
- Category with maximum data points is the category in which the new data point is classified.
As an example of implementation of KNN algorithm using OpenCV, we shall use the following image digits.png consisting of 5000 images of handwritten digits, each of 20X20 pixels.
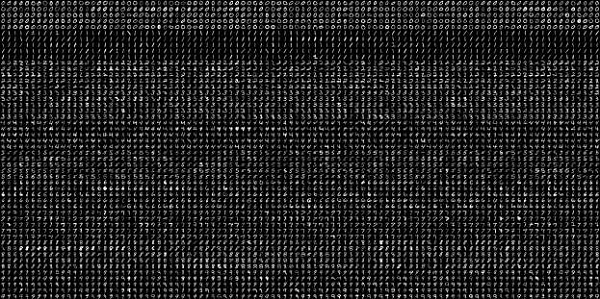
First task is to split this image into 5000 digits. This is our feature set. Convert it to a NumPy array. The program is given below −
import numpy as np
import cv2

image = cv2.imread('digits.png')
gray = cv2.cvtColor(image, cv2.COLOR_BGR2GRAY)

fset=[]
for i in np.vsplit(gray,50):
   x=np.hsplit(i,100)
   fset.append(x)

NP_array = np.array(fset)
Now we divide this data in training set and testing set, each of size (2500,20x20) as follows −
trainset = NP_array[:,:50].reshape(-1,400).astype(np.float32)
testset = NP_array[:,50:100].reshape(-1,400).astype(np.float32)
Next, we have to create 10 different labels for each digit, as shown below −
k = np.arange(10)
train_labels = np.repeat(k,250)[:,np.newaxis]
test_labels = np.repeat(k,250)[:,np.newaxis]
We are now in a position to start the KNN classification. Create the classifier object and train the data.
knn = cv2.ml.KNearest_create()
knn.train(trainset, cv2.ml.ROW_SAMPLE, train_labels)
Choosing the value of k as 3, obtain the output of the classifier.
ret, output, neighbours, distance = knn.findNearest(testset, k = 3)
Compare the output with test labels to check the performance and accuracy of the classifier.
The program shows an accuracy of 91.64% in detecting the handwritten digit accurately.
result = output==test_labels
correct = np.count_nonzero(result)
accuracy = (correct*100.0)/(output.size)
print(accuracy)
