- SciPy - Home
- SciPy - Introduction
- SciPy - Environment Setup
- SciPy - Basic Functionality
- SciPy - Relationship with NumPy
- SciPy Clusters
- SciPy - Clusters
- SciPy - Hierarchical Clustering
- SciPy - K-means Clustering
- SciPy - Distance Metrics
- SciPy Constants
- SciPy - Constants
- SciPy - Mathematical Constants
- SciPy - Physical Constants
- SciPy - Unit Conversion
- SciPy - Astronomical Constants
- SciPy - Fourier Transforms
- SciPy - FFTpack
- SciPy - Discrete Fourier Transform (DFT)
- SciPy - Fast Fourier Transform (FFT)
- SciPy Integration Equations
- SciPy - Integrate Module
- SciPy - Single Integration
- SciPy - Double Integration
- SciPy - Triple Integration
- SciPy - Multiple Integration
- SciPy Differential Equations
- SciPy - Differential Equations
- SciPy - Integration of Stochastic Differential Equations
- SciPy - Integration of Ordinary Differential Equations
- SciPy - Discontinuous Functions
- SciPy - Oscillatory Functions
- SciPy - Partial Differential Equations
- SciPy Interpolation
- SciPy - Interpolate
- SciPy - Linear 1-D Interpolation
- SciPy - Polynomial 1-D Interpolation
- SciPy - Spline 1-D Interpolation
- SciPy - Grid Data Multi-Dimensional Interpolation
- SciPy - RBF Multi-Dimensional Interpolation
- SciPy - Polynomial & Spline Interpolation
- SciPy Curve Fitting
- SciPy - Curve Fitting
- SciPy - Linear Curve Fitting
- SciPy - Non-Linear Curve Fitting
- SciPy - Input & Output
- SciPy - Input & Output
- SciPy - Reading & Writing Files
- SciPy - Working with Different File Formats
- SciPy - Efficient Data Storage with HDF5
- SciPy - Data Serialization
- SciPy Linear Algebra
- SciPy - Linalg
- SciPy - Matrix Creation & Basic Operations
- SciPy - Matrix LU Decomposition
- SciPy - Matrix QU Decomposition
- SciPy - Singular Value Decomposition
- SciPy - Cholesky Decomposition
- SciPy - Solving Linear Systems
- SciPy - Eigenvalues & Eigenvectors
- SciPy Image Processing
- SciPy - Ndimage
- SciPy - Reading & Writing Images
- SciPy - Image Transformation
- SciPy - Filtering & Edge Detection
- SciPy - Top Hat Filters
- SciPy - Morphological Filters
- SciPy - Low Pass Filters
- SciPy - High Pass Filters
- SciPy - Bilateral Filter
- SciPy - Median Filter
- SciPy - Non - Linear Filters in Image Processing
- SciPy - High Boost Filter
- SciPy - Laplacian Filter
- SciPy - Morphological Operations
- SciPy - Image Segmentation
- SciPy - Thresholding in Image Segmentation
- SciPy - Region-Based Segmentation
- SciPy - Connected Component Labeling
- SciPy Optimize
- SciPy - Optimize
- SciPy - Special Matrices & Functions
- SciPy - Unconstrained Optimization
- SciPy - Constrained Optimization
- SciPy - Matrix Norms
- SciPy - Sparse Matrix
- SciPy - Frobenius Norm
- SciPy - Spectral Norm
- SciPy Condition Numbers
- SciPy - Condition Numbers
- SciPy - Linear Least Squares
- SciPy - Non-Linear Least Squares
- SciPy - Finding Roots of Scalar Functions
- SciPy - Finding Roots of Multivariate Functions
- SciPy - Signal Processing
- SciPy - Signal Filtering & Smoothing
- SciPy - Short-Time Fourier Transform
- SciPy - Wavelet Transform
- SciPy - Continuous Wavelet Transform
- SciPy - Discrete Wavelet Transform
- SciPy - Wavelet Packet Transform
- SciPy - Multi-Resolution Analysis
- SciPy - Stationary Wavelet Transform
- SciPy - Statistical Functions
- SciPy - Stats
- SciPy - Descriptive Statistics
- SciPy - Continuous Probability Distributions
- SciPy - Discrete Probability Distributions
- SciPy - Statistical Tests & Inference
- SciPy - Generating Random Samples
- SciPy - Kaplan-Meier Estimator Survival Analysis
- SciPy - Cox Proportional Hazards Model Survival Analysis
- SciPy Spatial Data
- SciPy - Spatial
- SciPy - Special Functions
- SciPy - Special Package
- SciPy Advanced Topics
- SciPy - CSGraph
- SciPy - ODR
- SciPy Useful Resources
- SciPy - Reference
- SciPy - Quick Guide
- SciPy - Cheatsheet
- SciPy - Useful Resources
- SciPy - Discussion
SciPy - Hiearchical Clustering
What is Hierarchical Clustering?
In Scipy Hierarchical clustering is a method of cluster analysis that builds a hierarchy of clusters by either successively merging smaller clusters into larger ones i.e. agglomerative approach or splitting larger clusters into smaller ones i.e. divisive approach.
This method does not require specifying the number of clusters beforehand. The result is typically visualized using a dendrogram which is a tree-like diagram showing the arrangement and distance between clusters at each step.
Hierarchical clustering helps us to reveal the data's natural structure and relationships by making it useful for exploratory data analysis and identifying patterns or groupings in complex datasets.
Types of Hierarchical Clustering
Hierarchical clustering can be categorized based on its approach to forming clusters. Each type of Hierarchical clustering has different methods for building clusters and varies in how it handles the data.
Following are the two primary types of hierarchical clustering −
Agglomerative Hierarchical Clustering − This approach is bottom-up. It starts with each data point as its own individual cluster and progressively merges the closest pairs of clusters.
Divisive Hierarchical Clustering − This approach is top-down. It starts with all data points in a single cluster and recursively splits it into smaller clusters.
Now let's see in detail about each type of Hierarchical Clustering.
Agglomerative Hierarchical Clustering
Agglomerative hierarchical clustering is a bottom-up approach where each data point starts as its own cluster. It iteratively merges the closest pairs of clusters based on a chosen linkage criterion such as single, complete or average linkage until all points are grouped into a single cluster or a predefined number of clusters is reached.
This method builds a hierarchy of clusters which is often visualized using a dendrogram, illustrating the sequence of merges and the distances at which they occurred. It is widely used in data analysis to uncover the underlying structure and relationships within data.
Agglomerative hierarchical clustering in SciPy
SciPy has scipy.cluster.hierarchy module which provides comprehensive tools for performing agglomerative hierarchical clustering which is a method of cluster analysis that builds a hierarchy of clusters through a series of merging operations.
Below are the functions which are used to perform Agglomerative Hierarchical Clustering −
Linkage Computation
The linkage() function computes the hierarchical clustering encoded in a linkage matrix. This matrix describes the clustering process and is used for further analysis.
Syntax
Here is the syntax of Scipy Agglomerative Hierarchical Clustering linkage() function −
scipy.cluster.hierarchy.linkage(Y, method='ward', metric='euclidean')
Parameters
Following are the parameters of the linkage() function of the Agglomerative Hierarchical Clustering −
Y − Distance matrix i.e. condensed form from pdist or a square matrix representing pairwise distances.
method − This is the linkage method such as 'single', 'complete', 'average', 'ward'.
metric − This Parameter is Distance metric. The default value is 'euclidean'.
Example
Following is the example of using the linkage() function of Agglomerative Hierarchical Clustering. This example performs hierarchical clustering using SciPys linkage function with Wards method −
from scipy.cluster.hierarchy import linkage
import numpy as np

# Generate random sample data
data = np.random.rand(10, 2)  # 10 points in 2D space

# Compute the linkage matrix
Z = linkage(data, method='ward')
print(Z)
Output
Following is the output of the linkage() function −
[[ 0.          7.          0.0505634   2.        ]
 [ 4.         10.          0.09255057  3.        ]
 [ 1.          5.          0.15725673  2.        ]
 [ 2.          8.          0.22920974  2.        ]
 [ 9.         11.          0.24129559  4.        ]
 [ 3.         13.          0.29270489  3.        ]
 [ 6.         14.          0.32005747  5.        ]
 [12.         15.          0.93642962  5.        ]
 [16.         17.          0.98112101 10.        ]]
Dendrogram Visualization
The dendrogram() function creates a dendrogram which is a tree-like diagram that shows the arrangement and distances of clusters as they are merged.
Syntax
Here is the syntax of Scipy Agglomerative Hierarchical Clustering dendrogram() function −
scipy.cluster.hierarchy.dendrogram(Z, **kwargs)
Parameters
Below are the parameters of the dendrogram() function of the agglomerative hierarchical clustering−
Z − Linkage Matrix
kwargs − These are the optional arguments for customization such as color_threshold, labels, leaf_rotation.
Example
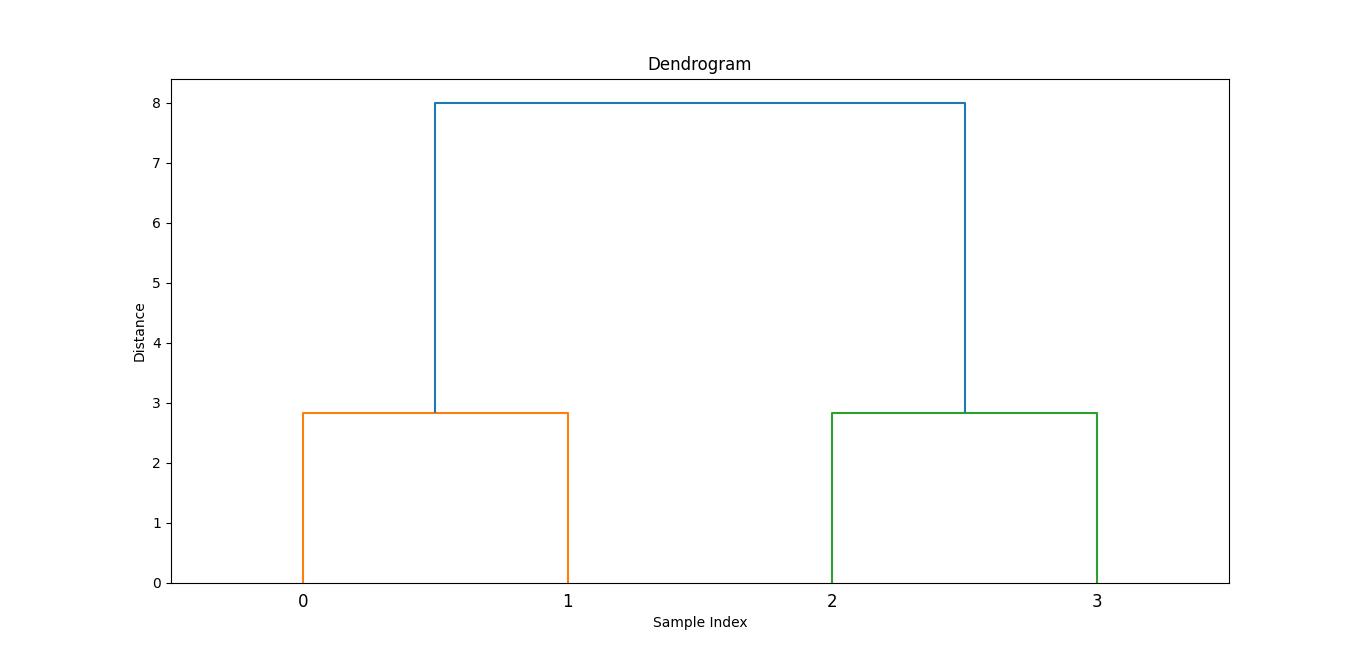
Here is the example of using the dendrogram() function of Agglomerative Hierarchical Clustering which generates the image of the matrix computed with the help of linkage() function −
from scipy.cluster.hierarchy import dendrogram
import matplotlib.pyplot as plt
from scipy.cluster.hierarchy import linkage
import numpy as np
data = np.array([[1, 2], [3, 4], [5, 6], [7, 8]])
Z = linkage(data, method='ward')
plt.figure(figsize=(10, 7))
dendrogram(Z)
plt.title('Dendrogram')
plt.xlabel('Sample Index')
plt.ylabel('Distance')
plt.show()
Output
Here is the output image generated with the help of dendrogram function −
Forming Flat Clusters
The fcluster function in SciPy is used to extract flat clusters from hierarchical clustering results defined by a linkage matrix. This function converts the hierarchical clustering into a specific number of clusters or based on a distance threshold by making it easier to work with and interpret the results.
Syntax
Here is the syntax of Scipy Agglomerative Hierarchical Clustering dendrogram() function −
scipy.cluster.hierarchy.fcluster(Z, t, criterion='inconsistent', **kwargs)
Parameters
Here are the parameters of the fcluster() function of the Scipy Agglomerative Hierarchical Clustering −
Z: The linkage matrix obtained from the linkage function which represents the hierarchical clustering of the data.
t: The threshold for forming flat clusters.
criterion: This parameter determines how the flat clusters are formed.
**kwargs: Additional keyword arguments which can defined depending on the criterion
Example
Here is the example of the fcluster() function which converts the hierarchical clustering results into a format that is easier to analyze and interpret by allowing for practical application of clustering results −
from scipy.cluster.hierarchy import fcluster
from scipy.cluster.hierarchy import linkage
import numpy as np
data = np.array([[1, 2], [3, 4], [5, 6], [7, 8]])
Z = linkage(data, method='ward')
clusters = fcluster(Z, t=3, criterion='maxclust')  # Form 3 clusters
print(f"Cluster assignments: {clusters}")
Output
Below is the output of the fcluster() function −
Cluster assignments: [1 1 2 2]
Divisive Hierarchical Clustering
Divisive Hierarchical Clustering is a clustering method where the process starts with a single, all-encompassing cluster containing all data points and iteratively splits it into smaller clusters until each cluster meets a certain criterion or the desired number of clusters is achieved.
This is in contrast to Agglomerative Hierarchical Clustering which begins with individual data points and merges them into larger clusters.
SciPy does not provide a built-in implementation for Divisive Hierarchical Clustering. Let's see how we can illustrate how it might be implemented manually in Python. Below are the steps to be followed to implement the Divisive Hierarchical Clustering manually −
Initialize with all data points in one cluster.
Iteratively split the largest cluster.
Repeat this until the desired number of clusters are achieved.
For simplicity the below example will use a basic approach to splitting clusters but note that real-world implementations might be more sophisticated.
import numpy as np
import matplotlib.pyplot as plt
from scipy.spatial.distance import cdist
def split_cluster(cluster):
""" Split a cluster into two sub-clusters based on a simple approach. """
# Compute the centroid of the cluster
centroid = np.mean(cluster, axis=0)
# Compute distances from each point to the centroid
distances = cdist(cluster, [centroid], metric='euclidean').ravel()
# Split the cluster into two based on distance from the centroid
median_distance = np.median(distances)
cluster1 = cluster[distances < median_distance]
cluster2 = cluster[distances >= median_distance]
return cluster1, cluster2
def divisive_clustering(data, n_clusters):
""" Perform Divisive Hierarchical Clustering. """
clusters = [data]
while len(clusters) < n_clusters:
# Find the largest cluster to split
largest_cluster = max(clusters, key=len)
clusters.remove(largest_cluster)
# Split the largest cluster
cluster1, cluster2 = split_cluster(largest_cluster)
# Add the new clusters
clusters.append(cluster1)
clusters.append(cluster2)
return clusters
# Generate synthetic data
np.random.seed(0)
data = np.random.rand(100, 2) # 100 points in 2D space
# Perform divisive hierarchical clustering
n_clusters = 4
clusters = divisive_clustering(data, n_clusters)
# Plot the clusters
plt.figure(figsize=(8, 6))
for cluster in clusters:
plt.scatter(cluster[:, 0], cluster[:, 1])
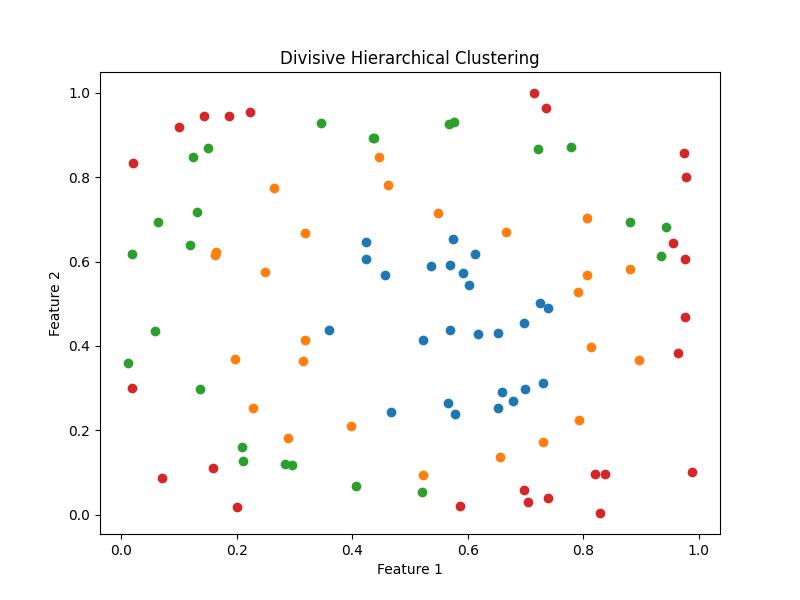
plt.title('Divisive Hierarchical Clustering')
plt.xlabel('Feature 1')
plt.ylabel('Feature 2')
plt.show()
Output
Following is the output of the Divisive Hierarchical Clustering −