
Article Categories
- All Categories
-
 Data Structure
-
 Networking
-
 RDBMS
RDBMS
-
 Operating System
-
 Java
Java
-
 MS Excel
-
 iOS
iOS
-
 HTML
HTML
-
 CSS
CSS
-
 Android
-
 Python
-
 C Programming
-
 C++
C++
-
 C#
C#
-
 MongoDB
-
 MySQL
MySQL
-
 Javascript
-
 PHP
PHP
-
 Economics & Finance
How to use Scatter chart graph in android?
This example demonstrate about How to use Scatter chart graph in android.
Step 1 − Create a new project in Android Studio, go to File ⇒ New Project and fill all required details to create a new project.
Step 2 − Open build.gradle(module level) and add library dependency.
apply plugin: 'com.android.application'
android {
   packagingOptions {
      exclude 'META-INF/proguard/androidx-annotations.pro'
   }
   packagingOptions {
      exclude 'META-INF/DEPENDENCIES'
      exclude 'META-INF/LICENSE'
      exclude 'META-INF/LICENSE.txt'
      exclude 'META-INF/license.txt'
      exclude 'META-INF/NOTICE'
      exclude 'META-INF/NOTICE.txt'
      exclude 'META-INF/notice.txt'
      exclude 'META-INF/ASL2.0'
   }
   compileSdkVersion 28
   defaultConfig {
      applicationId "com.example.andy.myapplication"
      minSdkVersion 15
      targetSdkVersion 28
      versionCode 1
      versionName "1.0"
      testInstrumentationRunner "android.support.test.runner.AndroidJUnitRunner"
   }
   buildTypes {
      release {
         minifyEnabled false
         proguardFiles getDefaultProguardFile('proguard-android.txt'), 'proguard-rules.pro'
      }
   }
}
dependencies {
   implementation fileTree(dir: 'libs', include: ['*.jar'])
   implementation 'com.android.support:appcompat-v7:28.0.0'
   implementation 'com.android.support.constraint:constraint-layout:1.1.3'
   implementation 'com.github.PhilJay:MPAndroidChart:v3.1.0-alpha'
   testImplementation 'junit:junit:4.12'
   androidTestImplementation 'com.android.support.test:runner:1.0.2'
   androidTestImplementation 'com.android.support.test.espresso:espresso-core:3.0.2'
}
Step 3 − Open build.gradle(application level) and add library dependency.
// Top-level build file where you can add configuration options common to all sub-projects/modules.
buildscript {
   repositories {
      google()
      jcenter()
   }
   dependencies {
      classpath 'com.android.tools.build:gradle:3.2.1'
      // NOTE: Do not place your application dependencies here; they belong
      // in the individual module build.gradle files
   }
}
allprojects {
   repositories {
      google()
      jcenter()
      maven { url 'https://jitpack.io' }
   }
}
task clean(type: Delete) {
   delete rootProject.buildDir
}
Step 4 − Add the following code to res/layout/activity_main.xml.
<?xml version = "1.0" encoding = "utf-8"?>
<android.support.constraint.ConstraintLayout xmlns:android = "http://schemas.android.com/apk/res/android"
   xmlns:app = "http://schemas.android.com/apk/res-auto"
   xmlns:tools = "http://schemas.android.com/tools"
   android:layout_width = "match_parent"
   android:layout_height = "match_parent"
   tools:context = ".MainActivity">
   <com.github.mikephil.charting.charts.ScatterChart
      android:id = "@+id/scatterChart"
      android:layout_width = "fill_parent"
      android:layout_height = "fill_parent" />
</android.support.constraint.ConstraintLayout>
In the above code, we have taken Scatter Chart view to show Scatter chart
Step 4 − Add the following code to src/MainActivity.java
package com.example.andy.myapplication;
import android.graphics.Color;
import android.os.Bundle;
import android.support.v7.app.AppCompatActivity;
import com.github.mikephil.charting.charts.ScatterChart;
import com.github.mikephil.charting.data.BarEntry;
import com.github.mikephil.charting.data.ScatterData;
import com.github.mikephil.charting.data.ScatterDataSet;
import com.github.mikephil.charting.utils.ColorTemplate;
import java.util.ArrayList;
public class MainActivity extends AppCompatActivity {
   ScatterChart scatterChart;
   ScatterData scatterData;
   ScatterDataSet scatterDataSet;
   ArrayList scatterEntries;
   @Override
   protected void onCreate(Bundle savedInstanceState) {
      super.onCreate(savedInstanceState);
      setContentView(R.layout.activity_main);
      scatterChart = findViewById(R.id.scatterChart);
      getEntries();
      scatterDataSet = new ScatterDataSet(scatterEntries, "");
      scatterData = new ScatterData(scatterDataSet);
      scatterChart.setData(scatterData);
      scatterDataSet.setColors(ColorTemplate.JOYFUL_COLORS);
      scatterDataSet.setValueTextColor(Color.BLACK);
      scatterDataSet.setValueTextSize(18f);
   }
   private void getEntries() {
      scatterEntries = new ArrayList<>();
      scatterEntries.add(new BarEntry(2f, 0));
      scatterEntries.add(new BarEntry(4f, 1));
      scatterEntries.add(new BarEntry(6f, 1));
      scatterEntries.add(new BarEntry(8f, 3));
      scatterEntries.add(new BarEntry(7f, 4));
      scatterEntries.add(new BarEntry(3f, 3));
   }
}
Let's try to run your application. I assume you have connected your actual Android Mobile device with your computer. To run the app from android studio, open one of your project's activity files and click Run ![]() icon from the toolbar. Select your mobile device as an option and then check your mobile device which will display your default screen –
icon from the toolbar. Select your mobile device as an option and then check your mobile device which will display your default screen –
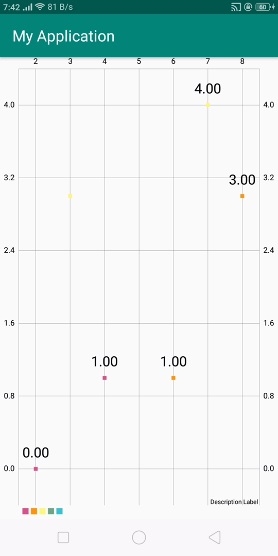
In the above result, it is showing scatter chart as per our data set values.
Click here to download the project code

739 Views
