 Data Structure
 Networking
 RDBMS
RDBMS Operating System
 Java
Java MS Excel
 iOS
iOS HTML
HTML CSS
CSS Android
 Python
 C Programming
 C++
C++ C#
C# MongoDB
 MySQL
MySQL Javascript
 PHP
PHP
- Selected Reading
- UPSC IAS Exams Notes
- Developer's Best Practices
- Questions and Answers
- Effective Resume Writing
- HR Interview Questions
- Computer Glossary
- Who is Who
How to Show Values on Seaborn Barplot?
In Seaborn's barplot, the average value of a numerical variable is displayed, while error bars indicate the range of possible values surrounding the average. When comparing values to 0, it is helpful. In Python, we have some built-in functions like barplot(), enumerate(), and, text() that can be used to Show Values on Seaborn Barplot. For example, we might compare the average sales of various products or the average test results of students in various classrooms using a barplot.
Syntax
The following syntax is used in the examples ?
barplot()
This is an in-built function in Python that will use to compare the similarities between categories. It can be used to compare the average value of different groups.
enumerate()
This is the built-in function in Python that adds a counter to iterable and returns the enumerated object. This function accepts two parameters- an iterable and a start index(the default value is 0).
show()
The show method is used at the end of the program that returns the result of the figure graph according to the problem statement.
Example 1
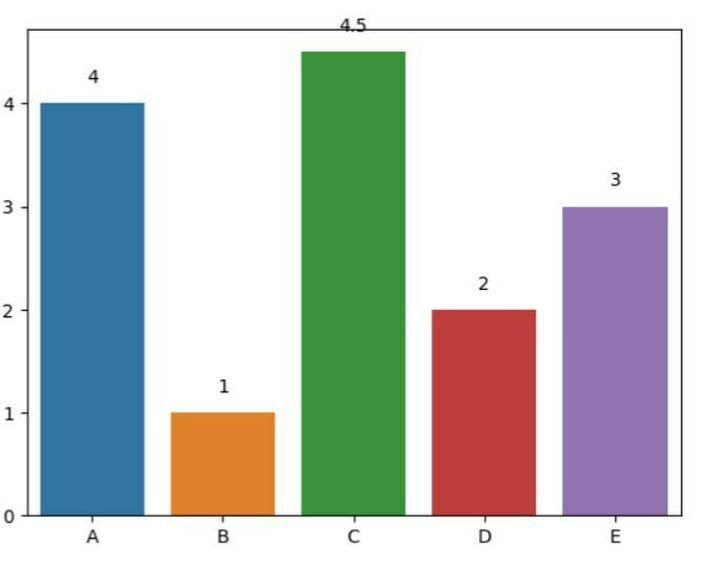
In the following example, we will show the values above the bars. Begin the program with the necessary module named seaborn and matplotlib.pyplot and take the reference object sns and plt respectively. Then it defines the two axes- x_ax and y_ax to fill data. Next, create the bar graph using the built-in function barplot() and store it in the variable ax. add values above the bars by iterating over the y values using enumerate() and adding text to the plot using ax.text(). Finally, use the show() method the return the result.
# Show values above bars
import seaborn as sns
import matplotlib.pyplot as plt

# Data
x_ax = ['A', 'B', 'C', 'D', 'E']
y_ax = [4, 1, 4.5, 2, 3]

# Create a barplot
ax = sns.barplot(x=x_ax, y=y_ax)

# Add values above bars
for i, v in enumerate(y):
   ax.text(i, v + 0.2, str(v), ha='center')
plt.show()
Output

Example 2
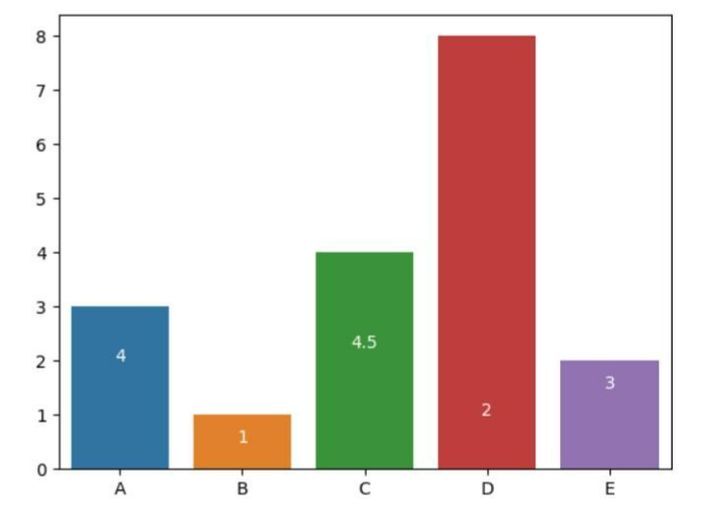
In the following example, we will start the program by importing the modules namely- seaborn and matplotlib.pyplot and take the reference object sns and plt respectively. Then create a bar plot using sns.barplot() with x_ax and y_ax as arguments for the x and y axes respectively. Next, Iterate over the y-axis data using a for loop with enumerate(y) to get both the index i and value v of each element in the list. Then use the text() method of the ax object to add text inside the bars. The first argument is the x-coordinate of the text, which is set to i to align with the center of each bar.
The second argument is the y-coordinate of the text, which is set to v/2 to position the text in the middle of each bar. The third argument is the text to be displayed, which is set to str(v) to display the value of each bar as a string. The ha argument is set to 'center' to horizontally align the text in the center of each bar. The color argument is set to 'white' to make the text white. Finally, we are getting the result with the help of the built-in method show().
# Show values inside bars
import seaborn as sns
import matplotlib.pyplot as plt

# Data
x_ax = ['A', 'B', 'C', 'D', 'E']
y_ax = [3, 1, 4, 8, 2]

# Create a barplot
ax = sns.barplot(x=x_ax, y=y_ax)
# Add values inside bars
for i, v in enumerate(y):
   ax.text(i, v/2, str(v), ha='center', color='white')
plt.show()
Output

Example 3
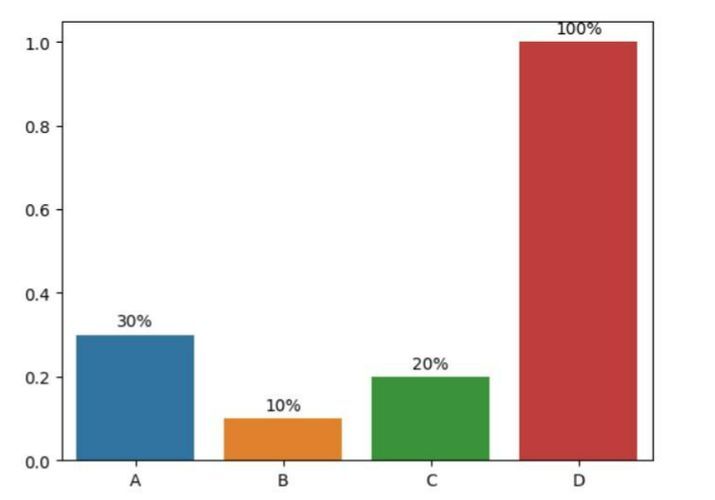
In the following example, we will show values with custom formatting. Begin the program by importing the necessary modules- seaborn for creating the bar plot and matplotlib.pyplot for displaying the plot. Then define the data for the x and y axes. Next, create a bar plot using sns.barplot() with x and y as arguments for the x and y axes respectively. Then iterate over the y-axis data using a for loop and add text inside the bars using the text() method of the ax object with custom formatting. Finally, display the plot using plt.show().
# Show values with custom formatting
import seaborn as sns
import matplotlib.pyplot as plt

# Data
x = ['A', 'B', 'C', 'D']
y = [0.3, 0.1, 0.2, 1]

# Create a barplot
ax = sns.barplot(x=x, y=y)

# Add values with custom formatting
for i, v in enumerate(y):
   ax.text(i, v + 0.02, f'{v:.0%}', ha='center')

plt.show()
Output

Example 4
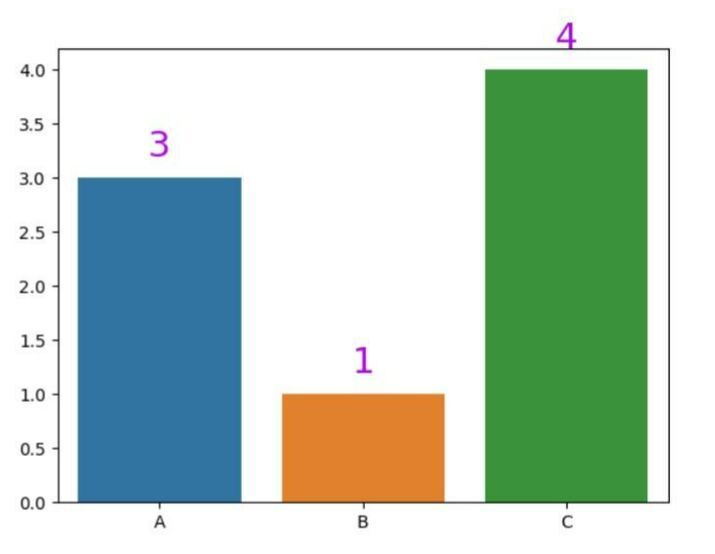
In the following example, we will show the values with custom color and font size. We will first mention the necessary modules- seaborn and matplotlib.pyplot. Then create the data for the x and y axis and set the bar according to axes using the built-in method barplot(). Then iterate over the y-axis data using a for loop and add text inside the bars using the text() method of the ax object with custom color and font size. In the end, display the plot using show().
# Show values with custom color and font size
import seaborn as sns
import matplotlib.pyplot as plt

# Data
x_axes = ['A', 'B', 'C']
y_axes = [3, 1, 4]

# Create a barplot
ax = sns.barplot(x=x_axes, y=y_axes)

# Add values with custom color and font size
for i, v in enumerate(y):
   ax.text(i, v + 0.2, str(v), ha='center', color='#ab09eb', fontsize=21)

plt.show()
Output

Example 5
In the following example, using the seaborn and matplotlib modules, this program generates a bar plot and displays values within the bars with custom position and rotation. The values are rotated by 45 degrees and positioned somewhat to the left of the center of each bar.
#Show values with custom position and rotation
import seaborn as sns
import matplotlib.pyplot as plt

# Data
x = ['A', 'B', 'C']
y = [3, 1, 4]

# Create a barplot
ax = sns.barplot(x=x, y=y)

# Add values with custom position and rotation
for i, v in enumerate(y):
   ax.text(i - 0.15, v + 0.2, str(v), ha='center', rotation=45)

plt.show()
Output

Conclusion
We discussed different ways to represent the Seaborn Barplot. We saw how enumerate() function helps to add a counter to iterate. Then we saw the formatting of values using references named ha, rotation, color, etc. This type of graph is normally used in the field of data science and data analytics.

