
Article Categories
- All Categories
-
 Data Structure
-
 Networking
-
 RDBMS
RDBMS
-
 Operating System
-
 Java
Java
-
 MS Excel
-
 iOS
iOS
-
 HTML
HTML
-
 CSS
CSS
-
 Android
-
 Python
-
 C Programming
-
 C++
C++
-
 C#
C#
-
 MongoDB
-
 MySQL
MySQL
-
 Javascript
-
 PHP
PHP
-
 Economics & Finance
Selected Reading
How to show values in boxplot in R?
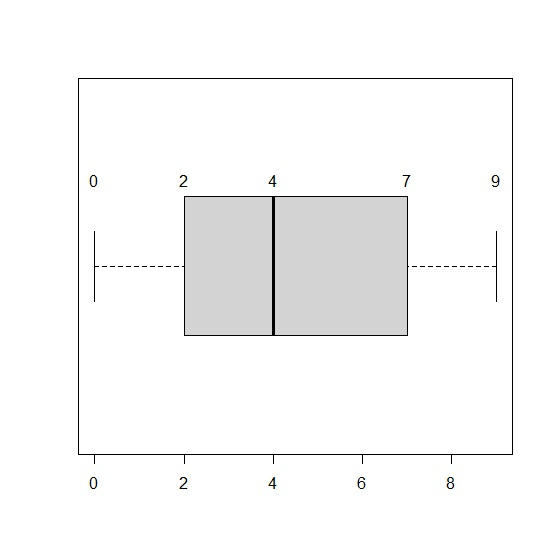
The main values in a boxplot are minimum, first quartile, median, third quartile, and the maximum, and this group of values is also called five-number summary. Therefore, if we want to show values in boxplot then we can use text function and provide the five-number summary and labels with fivenum function as shown in the below examples.
Example1
xOutput
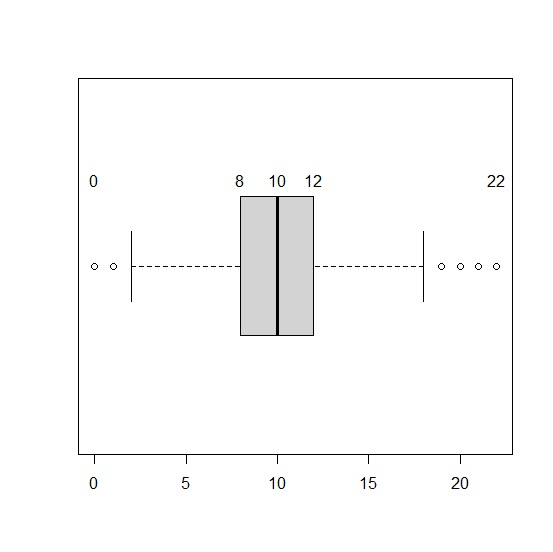
Example2
yOutput

Updated on: 2021-03-06T13:46:44+05:30
5K+ Views

Advertisements