
 Data Structure
 Networking
 RDBMS
RDBMS Operating System
 Java
Java MS Excel
 iOS
iOS HTML
HTML CSS
CSS Android
 Python
 C Programming
 C++
C++ C#
C# MongoDB
 MySQL
MySQL Javascript
 PHP
PHP
- Selected Reading
- UPSC IAS Exams Notes
- Developer's Best Practices
- Questions and Answers
- Effective Resume Writing
- HR Interview Questions
- Computer Glossary
- Who is Who
How can we run Matplotlib in Tkinter?
Python Matplotlib library is helpful in many applications for visualizing the given data and information in terms of graphs and plots. It is possible to run matplotlib in a Tkinter application. Generally, importing any Python library explicitly in an application gives access to all its functions and modules in the library.
To create a GUI application that uses matplotlib and its functions, we have to import the library using the command from matplotlib.pyplot as plt. However, we also use Tkagg in the backend that uses the Tkinter user interface interactively.
Example
In this example, we have imported Tkagg and matplotlib to visualize the given data points by plotting them inside a canvas widget.
# Import required libraries
from tkinter import *
from tkinter import ttk
import matplotlib
from matplotlib.figure import Figure
from matplotlib.backends.backend_tkagg import FigureCanvasTkAgg
# Create an instance of tkinter frame
win= Tk()
# Set the window size
win.geometry("700x350")
# Use TkAgg
matplotlib.use("TkAgg")
# Create a figure of specific size
figure = Figure(figsize=(3, 3), dpi=100)
# Define the points for plotting the figure
plot = figure.add_subplot(1, 1, 1)
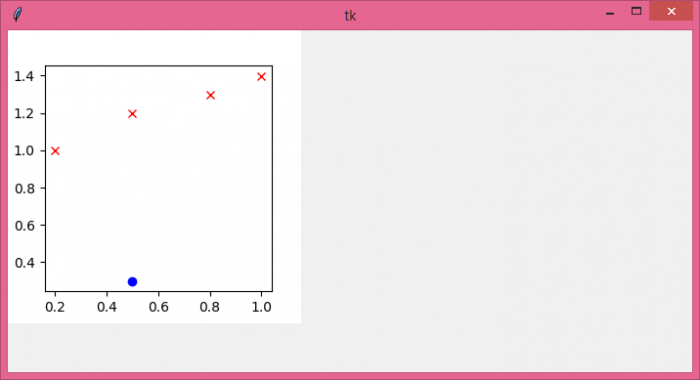
plot.plot(0.5, 0.3, color="blue", marker="o", linestyle="")
# Define Data points for x and y axis
x = [0.2,0.5,0.8,1.0 ]
y = [ 1.0, 1.2, 1.3,1.4]
plot.plot(x, y, color="red", marker="x", linestyle="")
# Add a canvas widget to associate the figure with canvas
canvas = FigureCanvasTkAgg(figure, win)
canvas.get_tk_widget().grid(row=0, column=0)
win.mainloop()
Output
When we run the above code, a plot will appear in the window with some data points on the X and Y axis.

2K+ Views
