
Article Categories
- All Categories
-
 Data Structure
-
 Networking
-
 RDBMS
RDBMS
-
 Operating System
-
 Java
Java
-
 MS Excel
-
 iOS
iOS
-
 HTML
HTML
-
 CSS
CSS
-
 Android
-
 Python
-
 C Programming
-
 C++
C++
-
 C#
C#
-
 MongoDB
-
 MySQL
MySQL
-
 Javascript
-
 PHP
PHP
-
 Economics & Finance
How to Resize Matplotlib RadioButtons
Matplotlib is a popular data visualization library in Python that provides a wide range of tools for creating interactive plots and charts. One of the interactive components offered by Matplotlib is the RadioButtons widget, which allows users to select a single option from a group of mutually exclusive choices. While working with RadioButtons, you may encounter situations where you need to resize them to better fit your plot or application layout. In this article, we will explore different methods to resize Matplotlib RadioButtons.
Syntax
radio_buttons.ax.set_position([left, bottom, width, height])
Here, radio_buttons refers to the instance of the RadioButtons widget. The set_position method sets the position and size of the widget using the rect parameter, which takes four values: left (the x?coordinate of the left edge), bottom (the y?coordinate of the bottom edge), width (the width of the widget), and height (the height of the widget).
Algorithm
A generalized algorithm for resizing the radio buttons in Matplotlib is as follows:
Import the necessary libraries: Start by importing the required libraries, including Matplotlib and NumPy, to work with the RadioButtons widget and perform the necessary calculations.
Create a figure and axes: Set up a Matplotlib figure and axes using the plt.subplots() function.
Generate the RadioButtons widget: Use the RadioButtons class from the matplotlib.widgets module to create the RadioButtons. Specify the list of labels and their initial selection as parameters.
Position and resize the RadioButtons: Modify the size and position of the RadioButtons by updating the rect parameter of the RadioButtons widget. The rect parameter defines the location and size of the widget using (left, bottom, width, height) values.
Create a function for the RadioButtons' event: Define a callback function that will be executed when a RadioButton is clicked. This function should update any plot or variable based on the selected option.
Connect the RadioButtons to the callback function: Use the on_clicked method of the RadioButtons widget to link the callback function with the widget.
Display the plot and RadioButtons: Finally, render the plot and the RadioButtons using the plt.show() function.
Example
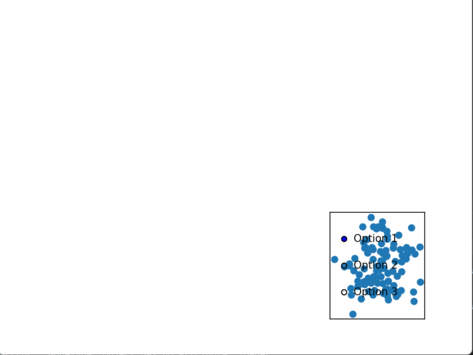
Let's consider a simple example where we have a scatter plot of randomly generated data, and we want to resize the RadioButtons.In the below example, we have positioned the RadioButtons in the bottom right corner of the plot by modifying the rect parameter ([0.7, 0.1, 0.2, 0.3]). You can adjust these values to fit your specific needs.
import matplotlib.pyplot as plt
import numpy as np
from matplotlib.widgets import RadioButtons

# Step 2: Create a figure and axes
fig, ax = plt.subplots()

# Step 3: Generate the RadioButtons widget
radio_labels = ['Option 1', 'Option 2', 'Option 3']
radio_buttons = RadioButtons(ax, radio_labels, active=0)

# Step 4: Position and resize the RadioButtons
radio_buttons.ax.set_position([0.7, 0.1, 0.2, 0.3])

# Step 5: Create a function for the RadioButtons' event
def on_radio_button_clicked(label):
    # Perform some action based on the selected option
    print("Selected option:", label)

# Step 6: Connect the RadioButtons to the callback function
radio_buttons.on_clicked(on_radio_button_clicked)

# Generate random data for scatter plot
np.random.seed(0)
x = np.random.randn(100)
y = np.random.randn(100)

# Step 7: Display the plot and RadioButtons
scatter_plot = ax.scatter(x, y)
plt.show()
Output
Example
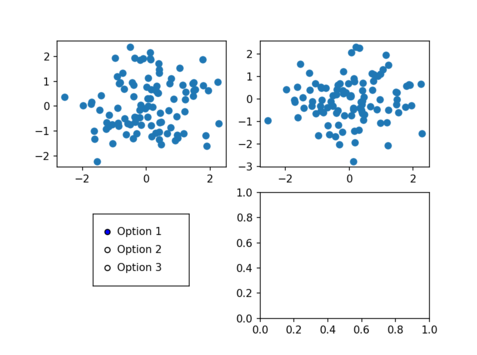
Resizing RadioButtons in a Subplot
In some cases, you may want to resize RadioButtons within a subplot. In the above example, we have created a 2x2 subplot grid and positioned the RadioButtons in the bottom?left subplot by modifying the rect parameter ([0.2, 0.2, 0.2, 0.2]).
import matplotlib.pyplot as plt
import numpy as np
from matplotlib.widgets import RadioButtons

# Step 2: Create a figure and subplots
fig, axs = plt.subplots(2, 2)

# Step 3: Generate the RadioButtons widget
radio_labels = ['Option 1', 'Option 2', 'Option 3']
radio_buttons = RadioButtons(axs[1, 0], radio_labels, active=0)

# Step 4: Position and resize the RadioButtons
radio_buttons.ax.set_position([0.2, 0.2, 0.2, 0.2])

# Step 5: Create a function for the RadioButtons' event
def on_radio_button_clicked(label):
    # Perform some action based on the selected option
    print("Selected option:", label)

# Step 6: Connect the RadioButtons to the callback function
radio_buttons.on_clicked(on_radio_button_clicked)

# Generate random data for subplots
np.random.seed(0)
x = np.random.randn(100)
y1 = np.random.randn(100)
y2 = np.random.randn(100)

# Step 7: Display the plot and RadioButtons
scatter_plot1 = axs[0, 0].scatter(x, y1)
scatter_plot2 = axs[0, 1].scatter(x, y2)

plt.show()
Output
Conclusion
In this article, we discussed how we can Resize Matplotlib Buttons using the rect parameter of the RadioButtons widget. We can adjust the size and position of the RadioButtons to suit our requirements. We also learned how to create a callback function to perform actions based on the selected option. The examples provided demonstrated how to resize RadioButtons in a single plot and within subplots.

252 Views
