
Article Categories
- All Categories
-
 Data Structure
-
 Networking
-
 RDBMS
RDBMS
-
 Operating System
-
 Java
Java
-
 MS Excel
-
 iOS
iOS
-
 HTML
HTML
-
 CSS
CSS
-
 Android
-
 Python
-
 C Programming
-
 C++
C++
-
 C#
C#
-
 MongoDB
-
 MySQL
MySQL
-
 Javascript
-
 PHP
PHP
-
 Economics & Finance
Selected Reading
How to change the color of a line using radiobuttons in Matplotlib?
To change the color of a line using radiobutton we can take following steps −
Create x and y data points using numpy.
Adjust the figure size and padding between and around the subplots.
Create a figure and a set of subplots using subplots() method.
Plot curve with x and y data points using plot() method.
Add an axes to the current figure and make it the current axes, using axes() method.
Add a radio button to the current axes.
Change the color of the curve with radion button using change_color() method, that can be passed in on_clicked() method.
To display the figure use show() method.
Example
import numpy as np
from matplotlib import pyplot as plt
from matplotlib.widgets import RadioButtons
plt.rcParams["figure.figsize"] = [7.50, 3.50]
plt.rcParams["figure.autolayout"] = True

x = np.linspace(-2, 2, 100)
y = np.sin(x)
fig, ax = plt.subplots()
curve, = ax.plot(x, y)
rb_axis = plt.axes([0.25, 0.60, 0.15, 0.15])
radio_button = RadioButtons(rb_axis, ('yellow', 'green', 'red',))

def change_color(c_label):
   curve.set_color(c_label)
   plt.draw()

radio_button.on_clicked(change_color)
plt.show()
Output
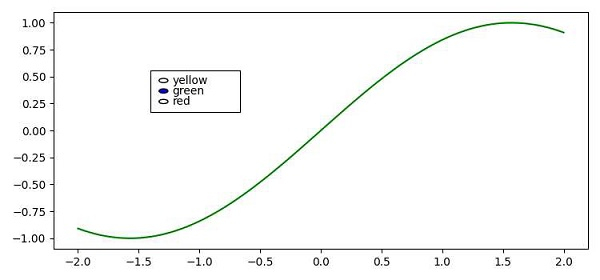
Now, use the radiobuttons to change the color of the curve inside the plot.

Updated on: 2021-04-09T13:09:01+05:30
468 Views

Advertisements