
Article Categories
- All Categories
-
 Data Structure
-
 Networking
-
 RDBMS
RDBMS
-
 Operating System
-
 Java
Java
-
 MS Excel
-
 iOS
iOS
-
 HTML
HTML
-
 CSS
CSS
-
 Android
-
 Python
-
 C Programming
-
 C++
C++
-
 C#
C#
-
 MongoDB
-
 MySQL
MySQL
-
 Javascript
-
 PHP
PHP
-
 Economics & Finance
Selected Reading
How to plot a histogram using Matplotlib in Python with a list of data?
To plot a histogram using Matplotlib, we can follow the steps given below −
Make a list of numbers and assign it to a variable x.
Use the plt.hist() method to plot a histogram.
Compute and draw the histogram of *x*.
We can pass n-Dimensional arrays in the hist argument also.
To show the plotted figure, use the plt.show() method.
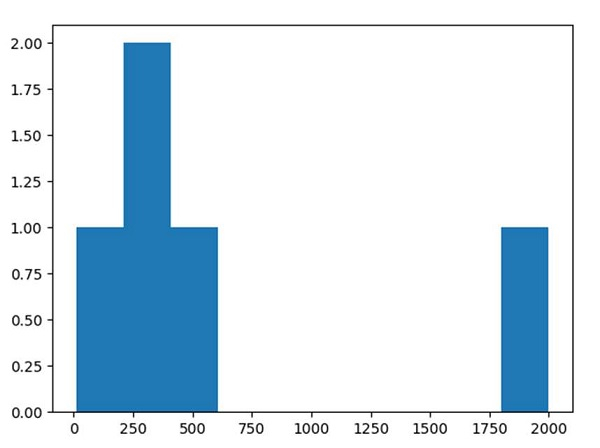
Example
from matplotlib import pyplot as plt

x = [300, 400, 500, 2000, 10]

plt.hist(x, 10)

plt.show()
Output

Updated on: 2021-03-15T07:40:11+05:30
15K+ Views

Advertisements