
Article Categories
- All Categories
-
 Data Structure
-
 Networking
-
 RDBMS
RDBMS
-
 Operating System
-
 Java
Java
-
 MS Excel
-
 iOS
iOS
-
 HTML
HTML
-
 CSS
CSS
-
 Android
-
 Python
-
 C Programming
-
 C++
C++
-
 C#
C#
-
 MongoDB
-
 MySQL
MySQL
-
 Javascript
-
 PHP
PHP
-
 Economics & Finance
How to plot a Histogram in MATLAB?
A histogram is a graphical representation of data that shows the frequency distribution of data points. MATLAB provides a builtin function "histogram" to plot the histogram of a data set.
What is a Histogram in MATLAB?
In MATLAB, the histogram is a graphical method of representing the frequency distribution of a set of data points. It shows the frequency distribution of a data points within a certain interval called bin.
In a histogram plot, the intervals or bins are represented over the x-axis and the frequency of data points over the yaxis. In MATLAB, the histogram is an efficient way of representing and analyzing data graphically.
There is a builtin function named, "histogram" which we can use to plot the histogram of a data set in MATLAB. This function has different syntax formats to plot various types of histograms depending on the desired needs.
Let us now discuss various syntax formats of the "histogram" function in MATLAB.
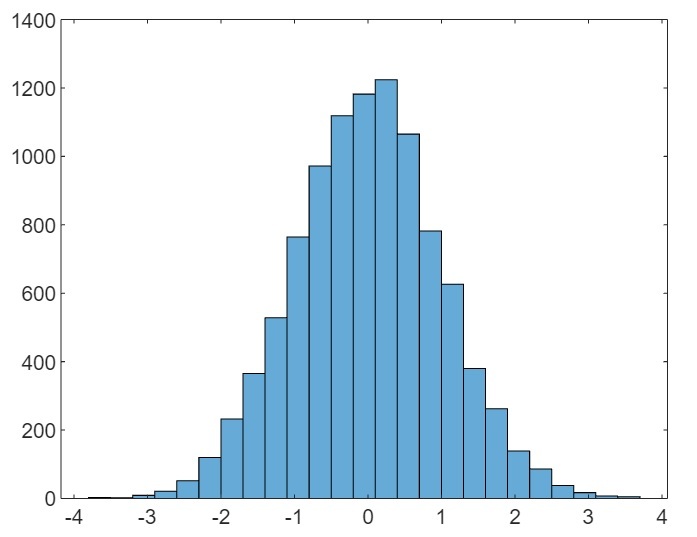
(1). Plot a Histogram with Default Properties
In MATLAB, the following syntax of the "histogram" function is used to plot a histogram of a data set with default properties.
histogram(X);
Here, X is the vector of data points.
The following example demonstrates how to create a histogram plot using this function.
Example (1)
% MATLAB code to plot default histogram
% Create a sample data set
X = randn(5000, 2);

% Plot the histogram for the data set
histogram(X);
Output

(2). Plot a Histogram with Specified Number of Bins
The following syntax of the "histogram" function is used to plot the histogram with specified number of bins or intervals.
histogram(X, bins);
Here, X is the vector of data sets and "bins" specifies the number of intervals for the histogram.
The following MATLAB code shows the implementation of this function,
Example (2)
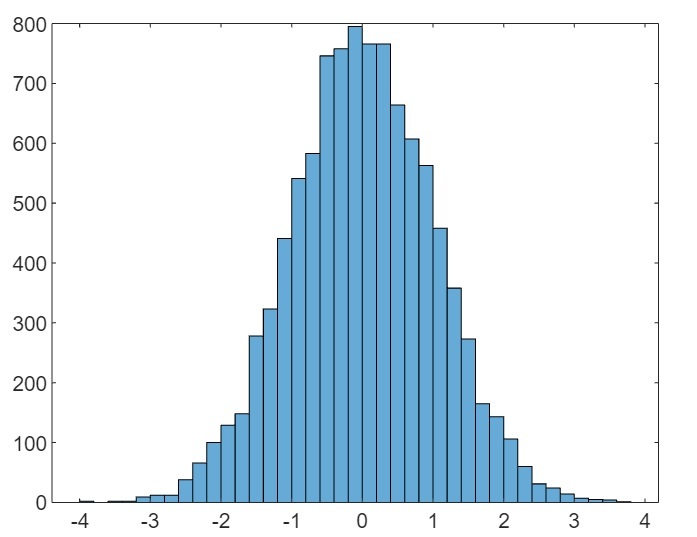
% MATLAB code to plot histogram with specified number of bins
% Create a sample data set
X = randn(5000, 2);

% Plot the histogram for the data set
histogram(X, 25);
Output
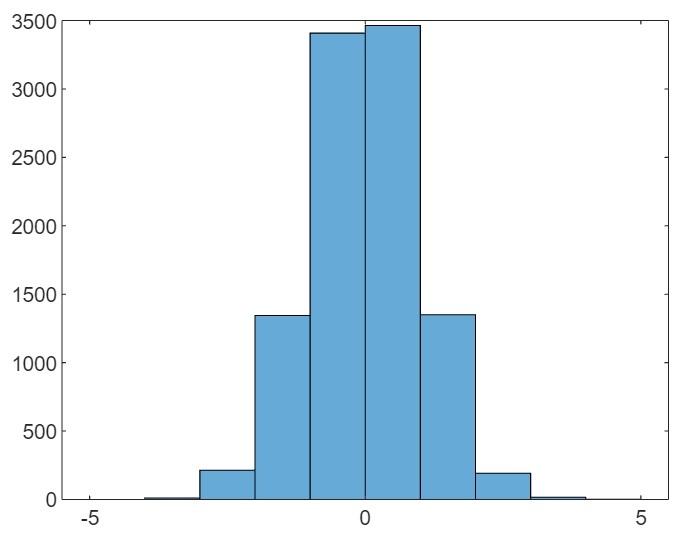
(3). Plot a Histogram with Specified Edges of Bins
To plot a histogram with specified edges of the bins, the following syntax of the "histogram" function is used.
histogram(X, edges);
Here, X is the vector containing data sets, and "edges" is the vector containing edges of the bins.
Let us see an example to understand the implementation of this function.
Example (3)
% MATLAB code to plot histogram with specified edges of the bins
% Create a sample data set
X = randn(5000, 2);

% Create a vector containing edges of bins
edges = [-5 -4 -3 -2 -1 0 1 2 3 4 5];

% Plot the histogram for the data set
histogram(X, edges);
Output
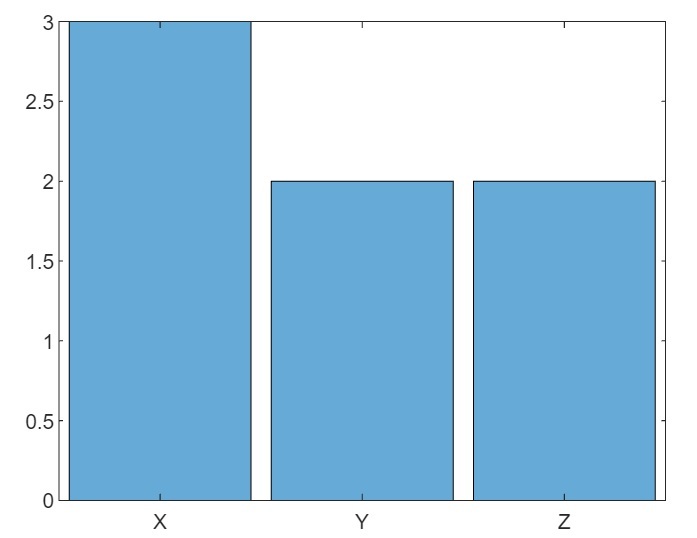
(4). Plot a Histogram of Categorical Data
The following syntax of the "histogram" function is used to plot a histogram of a categorical data.
histogram(C);
Here, C is the categorical data.
Example (4):
The following example demonstrates the implementation of this function.
% MATLAB code to plot histogram of categorical data
% Create a sample array of categories
cat = {'X', 'Y', 'Z', 'X', 'Y', 'X', 'Z'};

% Create categorical data
C = categorical(cat);

% Plot the histogram for the categorical data
histogram(C);
Output
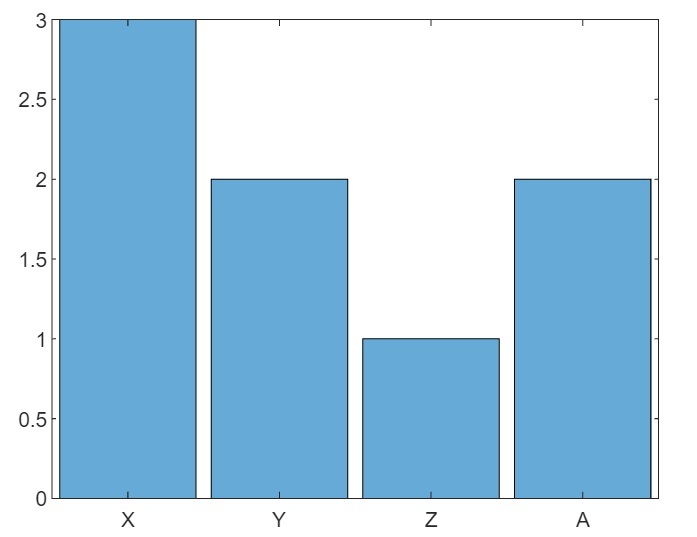
(5). Plot a Histogram of Categorical Data with Specified Categories
The following syntax of the "histogram" function is used to plot the histogram of categorical data with the specified categories.
histogram(C, Categories);
Let us see an example based on this function.
Example (5)
% MATLAB code to plot histogram of categorical data with specified categories
% Create a sample array of categories
cat = {'X', 'Y', 'Z', 'X', 'Y', 'X', 'Z'};

% Create categorical data
C = categorical(cat);

% Plot the histogram for the categorical data
histogram(C,{'X', 'Y', 'Z', 'A'});
Output

(6). Plot a Histogram of Categorical Data with Specified Categories and Precomputed Bin Counts
The following syntax of the "histogram" function is used to plot the histogram of categorical data with specified categories and precomputed bin counts.
histogram('Categories', Categories, 'BinCounts', counts);
Example (6)
Here is an example to demonstrate the implementation of this function.
% MATLAB program to plot categorical histogram with prespecified categories and bin counts
% Create sample categories
cat = {'X', 'Y', 'Z', 'X', 'Y', 'X', 'Z'};

% Calculate bin counts for each category
counts = [3, 2, 1, 2];

% Plot the histogram
histogram('Categories', {'X', 'Y', 'Z', 'A'}, 'BinCounts', counts);
Output
(7). Plot a Histogram with Customized Properties
The following syntax of the "histogram" function is used to plot the histogram with customized properties.
histogram(___, Name, Value);
Here, the custom properties of the histogram are specified using the Name-Value pairs.
Example (7)
Let us see an example to understand how to implement this function.
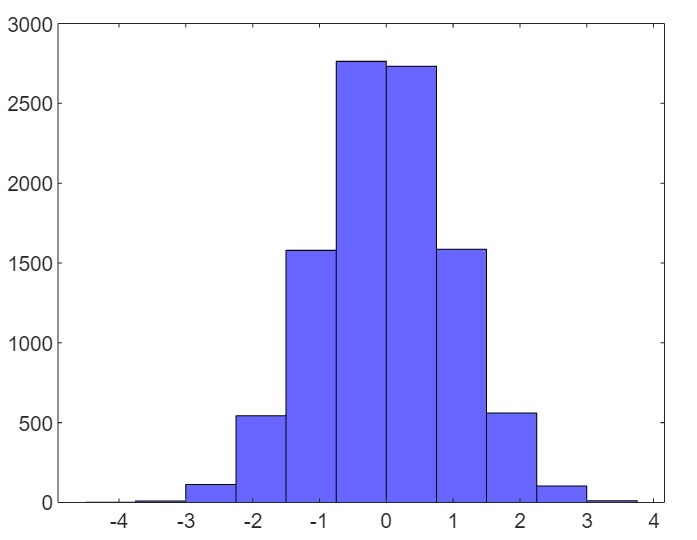
% MATLAB program to plot a histogram with customized properties
% Create a sample data set
X = randn(5000, 2);

% Plot the histogram with customized properties
histogram(X, 'FaceColor', 'blue', 'BinWidth', 0.75);
Output
(8). Plot a Histogram with Specified Axes
The following syntax of the "histogram" function is used to plot a histogram with the specified axes.
histogram(ax, ___);
Example (8)
The following MATLAB example demonstrates how to use this function to plot a histogram.
% MATLAB code to plot a histogram with specified axes
% Create a sample data set
X = randn(5000, 2);

% Specify the subplot axes
ax = subplot(1, 1, 1);

% Plot the histogram in the subplot
histogram(ax, X);
Output
Conclusion
MATLAB has a builtin function "histogram" to plot the histogram of a data set. In this tutorial, I have explained different syntax format of the "histogram" function depending on the different types of data and output requirements.

748 Views
