 Data Structure
 Networking
 RDBMS
RDBMS Operating System
 Java
Java MS Excel
 iOS
iOS HTML
HTML CSS
CSS Android
 Python
 C Programming
 C++
C++ C#
C# MongoDB
 MySQL
MySQL Javascript
 PHP
PHP
- Selected Reading
- UPSC IAS Exams Notes
- Developer's Best Practices
- Questions and Answers
- Effective Resume Writing
- HR Interview Questions
- Computer Glossary
- Who is Who
How to Normalize a Histogram in MATLAB?
A histogram is nothing but a graphical representation that shows the distribution of a set of data points. The normalization of a histogram is a process of distributing its frequencies over a wide range.
Before discussing the implementation of histogram normalization in MATLAB, let us first get an overview of histogram normalization.
What is Histogram Normalization?
A histogram is a graphical way of representing the distribution of frequencies of a dataset. Sometimes, we see a histogram in which the frequencies are distributed in a small range. It results in producing poor contrast in a digital image.
There is a technique called "histogram normalization" that is used to distribute the frequencies of datasets over a wide range.
In digital image processing, histogram normalization is used to improve the contrast levels in an image.
Mathematically, the histogram normalization is performed using the following formula,
$$\mathrm{Hist. Norm=\frac{(Intensity Min value)}{(Max \:Value Min \:Value)}× 255}$$
Now, let us discuss the process of histogram normalization in MATLAB.
Histogram Normalization in MATLAB
In MATLAB, the normalization of a histogram is performed as per the following steps
Step (1) Read the digital image whose histogram is to be normalized. For this, use the "imread" function.
Step (2) Convert the input image to gray scale if required. For this, use the "rgb2gray" function.
Step (3) Convert the grayscale image to double data type for calculations. For this, use the "double" function.
Step (4) Specify the minimum and maximum values required for histogram normalization.
Step (5) Use the histogram normalization formula to perform the normalization of the histogram.
Step (6) Display the result.
Example
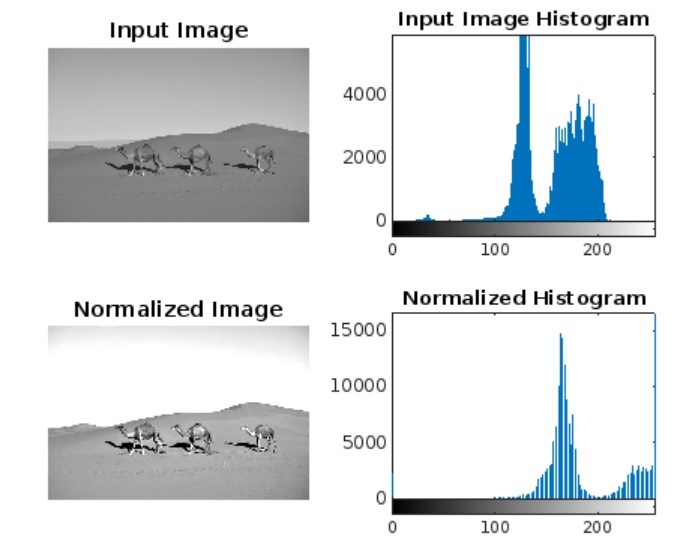
Let us take an example to understand the implementation and execution of these steps to perform histogram normalization of an image.
% MATLAB code to perform histogram normalization
% Read the input image
img = imread('https://www.tutorialspoint.com/assets/questions/media/14304-1687425269.jpg');

% Convert the input image to grayscale
gray_img = rgb2gray(img);

% Convert the grayscale image to double datatype
double_img = double(gray_img);

% Specify the minimum and maximum values for histogram normalization
min_value = 50;
max_value = 170;

% Perform histogram normalization
norm_img = (double_img - min_value) / (max_value - min_value);

% Scale the normalized image
scaled_img = norm_img * 255;

% Convert the scaled image to uint8 to display
hist_norm_img = uint8(scaled_img);

% Display the input image, normalized image, and their histograms
figure;
subplot(2, 2, 1);
imshow(gray_img);
title('Input Image');

subplot(2, 2, 2);
imhist(gray_img);
title('Input Image Histogram');

subplot(2, 2, 3);
imshow(hist_norm_img);
title('Normalized Image');

subplot(2, 2, 4);
imhist(hist_norm_img);
title('Normalized Histogram');
Output
When you run this code, it will produce the following output

Conclusion
In conclusion, the histogram normalization is a technique of distributing the frequencies of a dataset over a wide range to improve contrast levels. In this tutorial, I explained the stepbystep process of histogram normalization of an image with the help of an example in MATLAB.

