
Article Categories
- All Categories
-
 Data Structure
-
 Networking
-
 RDBMS
RDBMS
-
 Operating System
-
 Java
Java
-
 MS Excel
-
 iOS
iOS
-
 HTML
HTML
-
 CSS
CSS
-
 Android
-
 Python
-
 C Programming
-
 C++
C++
-
 C#
C#
-
 MongoDB
-
 MySQL
MySQL
-
 Javascript
-
 PHP
PHP
-
 Economics & Finance
How to calculate the moving/rolling average in an Excel?
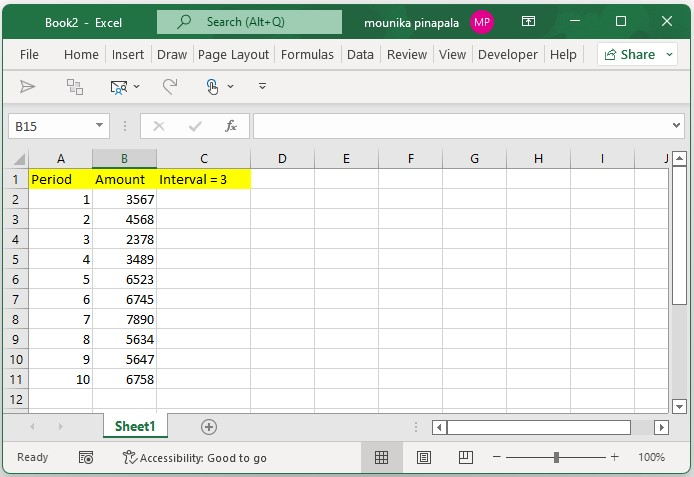
Consider you have a stock price data which is fluctuating very widely in recent times. Assume that you are recording this fluctuation and you want to forecast the price trend in a Microsoft excel sheet.
You need to apply the average function to calculate the moving or rolling average for a set of series data given in a Microsoft excel sheet. Kindly follow he below steps to understand easily.Step 1
Open a Microsoft excel sheet, and enter the data shown below you can enter the data as per your requirement to find the moving or rolling average from a set of data in an excel sheet. Kindly find the below screenshot for your reference.
Step 2
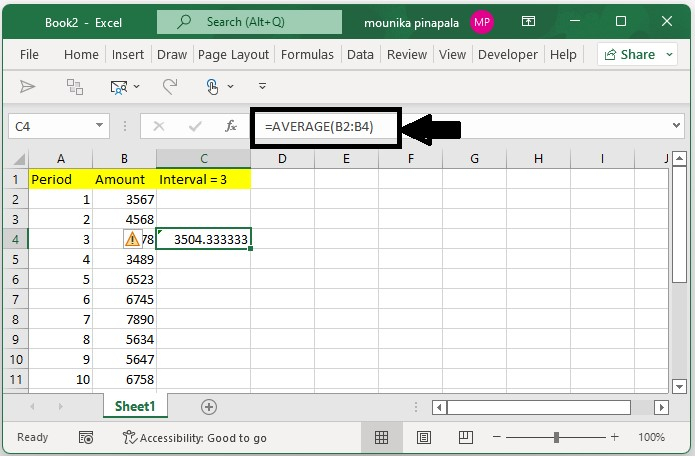
Now you need to select the third cell that is beside the original data in an excel sheet, consider it as cell C4 in our case and type the below given formula, and press the enter key as shown in the below screenshot for your reference.
=AVERAGE(B2:B4)
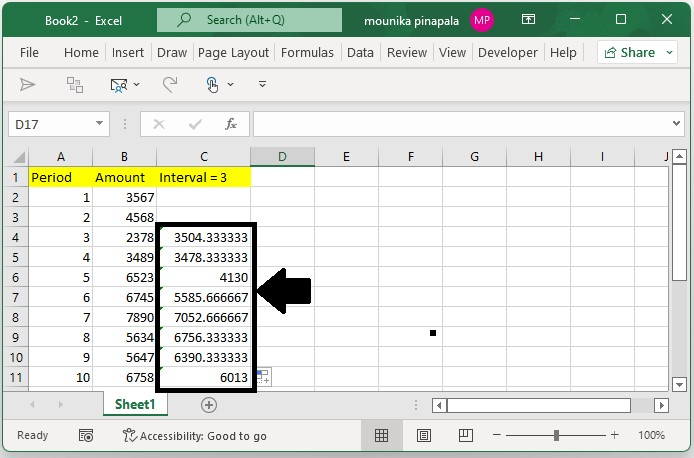
Step 3
Now you need to drag the fill handle down to the range in the excel sheet as shown in the below screenshot for your reference.
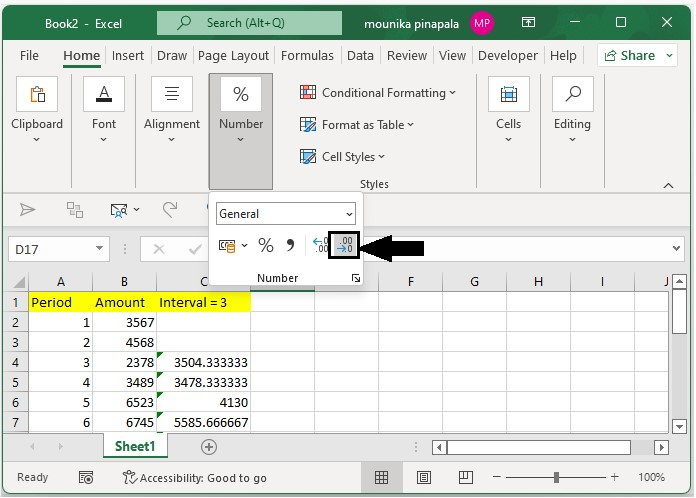
Step 4
You need to keep selecting the formula cells and you need to click on decreasing decimal button in an excel sheet to adjust the decimal place of the moving average or rolling average results as you need. Kindly find the below screenshot for your reference.
Note ? In the above formula, B2:B4 indicates the first three data values in the set of data in an excel sheet. Here you need to calculate the moving average with the interval of 3. Hence, we have entered the formula into the third cell.
Conclusion
In this tutorial, we used a simple example to show how you can calculate the moving average in Excel.

421 Views
