 Data Structure
 Networking
 RDBMS
RDBMS Operating System
 Java
Java MS Excel
 iOS
iOS HTML
HTML CSS
CSS Android
 Python
 C Programming
 C++
C++ C#
C# MongoDB
 MySQL
MySQL Javascript
 PHP
PHP
- Selected Reading
- UPSC IAS Exams Notes
- Developer's Best Practices
- Questions and Answers
- Effective Resume Writing
- HR Interview Questions
- Computer Glossary
- Who is Who
How to generate and plot classification dataset using Python Scikit-learn?
Scikit-learn provides us make_classification() function with the help of which we can plot randomly generated classification datasets with different numbers of informative features, clusters per class and classes. In this tutorial, we will learn how to generate and plot classification dataset using Python Scikit-learn.
Dataset with One Informative Feature and One Cluster per Class
To generate and plot classification dataset with one informative feature and one cluster, we can take the below given steps ?
Step 1 ? Import the libraries sklearn.datasets.make_classification and matplotlib which are necessary to execute the program.
Step 2 ? Create data points namely X and y with number of informative features and number of clusters per class parameters equal to 1.
Step 3 ? Use matplotlib lib to plot the dataset.
Example
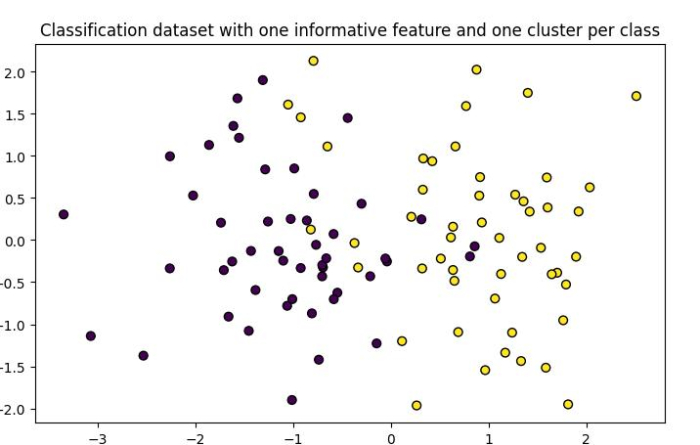
In the below example, we generate and print a classification dataset with one informative feature and one cluster per class.
# Importing libraries
from sklearn.datasets import make_classification
import matplotlib.pyplot as plt

# Creating the classification dataset with one informative feature and one cluster per class
X, y = make_classification(n_features=2, n_redundant=0, n_informative=1, n_clusters_per_class=1)

# Plotting the dataset
plt.figure(figsize=(7.50, 3.50))
plt.subplots_adjust(bottom=0.05, top=0.9, left=0.05, right=0.95)
plt.subplot(111)
plt.title("Classification dataset with one informative feature and one cluster per class", fontsize="12")

plt.scatter(X[:, 0], X[:, 1], marker="o", c=y, s=40, edgecolor="k")
plt.show()
Output
It will produce the following output ?

Dataset with Two Informative Features and One Cluster per Class
To generate and plot classification dataset with two informative features and one cluster per class, we can take the below given steps ?
Step 1 ? Import the libraries sklearn.datasets.make_classification and matplotlib which are necessary to execute the program.
Step 2 ? Create data points namely X and y with number of informative features equals to 2 and number of clusters per class parameter equal to 1.
Step 3 ? Use matplotlib lib to plot the dataset.
Example
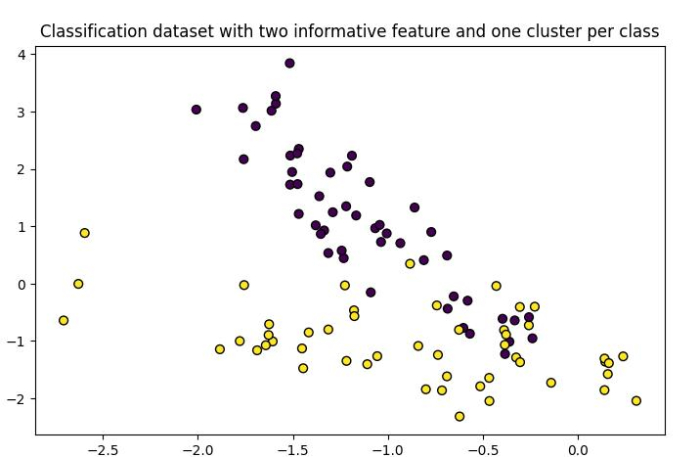
In the below example, we generate and print a classification dataset with two informative feature and one cluster per class.
# Importing libraries
from sklearn.datasets import make_classification
import matplotlib.pyplot as plt

# Creating the classification dataset with two informative feature and one cluster per class
X, y = make_classification(n_features=2, n_redundant=0, n_informative=2, n_clusters_per_class=1)

# Plotting the dataset
plt.figure(figsize=(7.50, 3.50))
plt.subplots_adjust(bottom=0.05, top=0.9, left=0.05, right=0.95)
plt.subplot(111)
plt.title("Classification dataset with two informative feature and one cluster per class", fontsize="12")
plt.scatter(X[:, 0], X[:, 1], marker="o", c=y, s=40, edgecolor="k")
plt.show()
Output
It will produce the following output ?

Dataset with Two Informative Features and Two Cluster per Class
To generate and plot classification dataset with two informative features and two cluster per class, we can take the below given steps ?
Step 1 ? Import the libraries sklearn.datasets.make_classification and matplotlib which are necessary to execute the program.
Step 2 ? Create data points namely X and y with number of informative features and number of clusters per class parameter equals to 2.
Step 3 ? Use matplotlib lib to plot the dataset.
Example
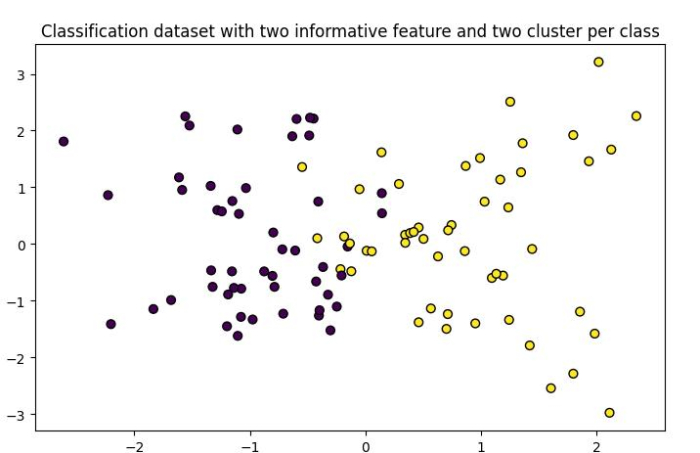
In the below example, we generate and print a classification dataset with two informative feature and two cluster per class.
# Importing libraries
from sklearn.datasets import make_classification
import matplotlib.pyplot as plt

# Creating the classification dataset with two informative feature and two cluster per class
X, y = make_classification(n_features=2, n_redundant=0, n_informative=2, n_clusters_per_class=2)

# Plotting the dataset
plt.figure(figsize=(7.50, 3.50))
plt.subplots_adjust(bottom=0.05, top=0.9, left=0.05, right=0.95)
plt.subplot(111)
plt.title("Classification dataset with two informative feature and two cluster per class", fontsize="12")
plt.scatter(X[:, 0], X[:, 1], marker="o", c=y, s=40, edgecolor="k")
plt.show()
Output
It will produce the following output ?

Multi-class Classification Dataset
To generate and plot multi-class classification dataset with two informative features and one cluster per class, we can take the below given steps ?
Step 1 ? Import the libraries sklearn.datasets.make_classification and matplotlib which are necessary to execute the program.
Step 2 ? Create data points namely X and y with number of informative features equals to 2, number of clusters per class parameter equals to 1, and number of classes parameter equals to 3.
Step 3 ? Use matplotlib lib to plot the dataset.
Example
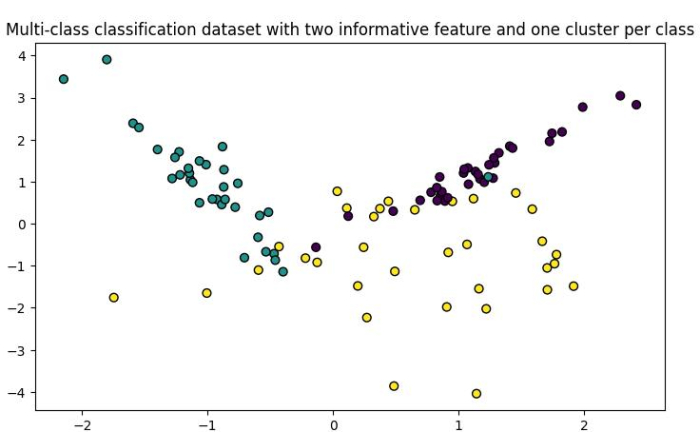
In the below example, we generate and print a multi-class classification dataset with two informative feature and one cluster per class.
# Importing libraries
from sklearn.datasets import make_classification
import matplotlib.pyplot as plt

# Creating the multi-class classification dataset with two informative feature and one cluster per class
X, y = make_classification(n_features=2, n_redundant=0, n_informative=2, n_clusters_per_class=1, n_classes=3)

# Plotting the dataset
plt.figure(figsize=(7.50, 3.50))
plt.subplots_adjust(bottom=0.05, top=0.9, left=0.05, right=0.95)
plt.subplot(111)
plt.title("Multi-class classification dataset with two informative feature and one cluster per class", fontsize="12")
plt.scatter(X[:, 0], X[:, 1], marker="o", c=y, s=40, edgecolor="k")
plt.show()
Output
It will produce the following output ?


