 Data Structure
 Networking
 RDBMS
RDBMS Operating System
 Java
Java MS Excel
 iOS
iOS HTML
HTML CSS
CSS Android
 Python
 C Programming
 C++
C++ C#
C# MongoDB
 MySQL
MySQL Javascript
 PHP
PHP
- Selected Reading
- UPSC IAS Exams Notes
- Developer's Best Practices
- Questions and Answers
- Effective Resume Writing
- HR Interview Questions
- Computer Glossary
- Who is Who
How to generate a symmetric positive-definite matrix using Python Scikit-Learn?
Python Scikit-learn provides us make_spd_matrix() function with the help of which we can generate a random symmetric positive-definite matrix. In this tutorial, we will generate symmetric positive-definite and sparse spd matrices using Scikit-learn (Sklearn) in Python.
To do so, we can follow the below given steps ?
Step 1 ? Import the libraries sklearn.datasets.make_spd_matrix, matplotlib, and seaborn which are necessary to execute the program.
Step 2 ? Create an object of make_spd_matrix() and provide the value of n_dim parameter which represents the matrix dimension.
Step 3 ? Use matplotlib lib to set the size of the output figure.
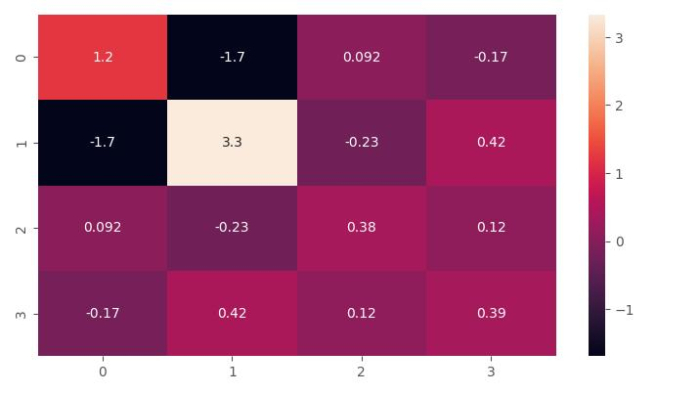
Step 4 ? Use seaborn library to plot the matrix as a color-encoded scheme.
Example
# Importing libraries
from sklearn.datasets import make_spd_matrix
from matplotlib import pyplot as plt
from matplotlib import style
import seaborn as sns

# Set the figure size
plt.rcParams["figure.figsize"] = [7.16, 3.50]
plt.rcParams["figure.autolayout"] = True
plt.show()

# Creating and plotting Sparse Positive-Definite matrix of dimension 4
style.use("ggplot")

spd = make_spd_matrix(n_dim=4, random_state=1)
sns.heatmap(data=spd, annot=True, cmap='rocket')
plt.show()
Output
It will produce the following output

Example
Check the values of the above generated sparse positive Definite matrix ?
import pandas as pd
from sklearn.datasets import make_spd_matrix
spd = make_spd_matrix(n_dim=4, random_state=1)
print(pd.DataFrame(spd))
Output
It will produce the following output
      0           1        2           3
0   1.214261  -1.693503   0.092278  -0.167397
1  -1.693503   3.331807  -0.230052   0.424357
2   0.092278  -0.230052   0.381256   0.119570
3  -0.167397   0.424357   0.119570   0.387159
Generating a Sparse spd Matrix
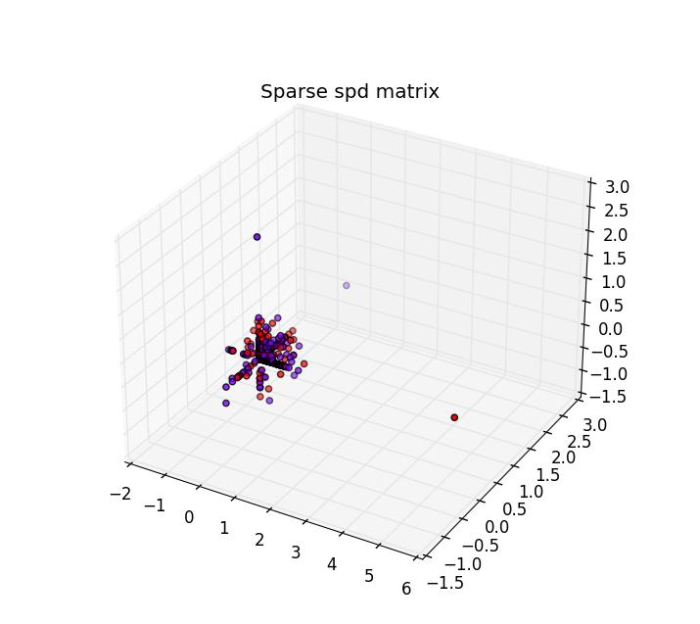
Python Scikit-learn provides us make_sparse_spd_matrix() function with the help of which we can generate a sparse symmetric positive-definite (spd) matrix.
To generate it and plot it in 3-dimensional, we can follow the below given steps ?
Step 1 ? Import the libraries sklearn.datasets.make_sparse_spd_matrix() and matplotlib which are necessary to execute the program.
Step 2 ? Provide the number of samples and other parameters.
Step 3 ? Use Numpy to create a random array. This array should have the same number of elements as we provide in the sklearn.datasets.make_sparse_spd_matrix() function.
Step 4 ? Use matplotlib library to set the size and style of the output figure.
Step 5 ? Construct a 3D graph using matplotlib to illustrate sparse spd matrix.
Example
In the below example, we will be generating sparse spd matrix with 500 samples.
# Importing libraries
from sklearn.datasets import make_sparse_spd_matrix
import numpy as np
import matplotlib.pyplot as plt
import matplotlib.style
import matplotlib as mpl
mpl.style.use('classic')
from mpl_toolkits.mplot3d import Axes3D

# Creating Sparse spd matrix
X= make_sparse_spd_matrix(dim=500, random_state=0)

#Creating a random array 'y'(it's not sparse)
from numpy import random
y=random.randint(2, size=(500))

# Plotting the sparse spd matrix in 3-dimensional
figure_3D = plt.figure(figsize=(7.50,3.50))
plt.subplots_adjust(bottom=0.05, top=0.9, left=0.05, right=0.95)
ax = figure_3D.add_subplot(111, projection='3d')
ax.scatter(X[:, 0], X[:, 1], X[:, 2], c=y, cmap=plt.cm.rainbow)
plt.title('Sparse spd matrix')
plt.show()
Output
It will produce the following output ?


