 Data Structure
 Networking
 RDBMS
RDBMS Operating System
 Java
Java MS Excel
 iOS
iOS HTML
HTML CSS
CSS Android
 Python
 C Programming
 C++
C++ C#
C# MongoDB
 MySQL
MySQL Javascript
 PHP
PHP
- Selected Reading
- UPSC IAS Exams Notes
- Developer's Best Practices
- Questions and Answers
- Effective Resume Writing
- HR Interview Questions
- Computer Glossary
- Who is Who
How to implement linear classification with Python Scikit-learn?
Linear classification is one of the simplest machine learning problems. To implement linear classification, we will be using sklearn's SGD (Stochastic Gradient Descent) classifier to predict the Iris flower species.
Steps
You can follow the below given steps to implement linear classification with Python Scikit-learn ?
Step 1 ? First import the necessary packages scikit-learn, NumPy, and matplotlib
Step 2 ? Load the dataset and build a training and testing dataset out of it.
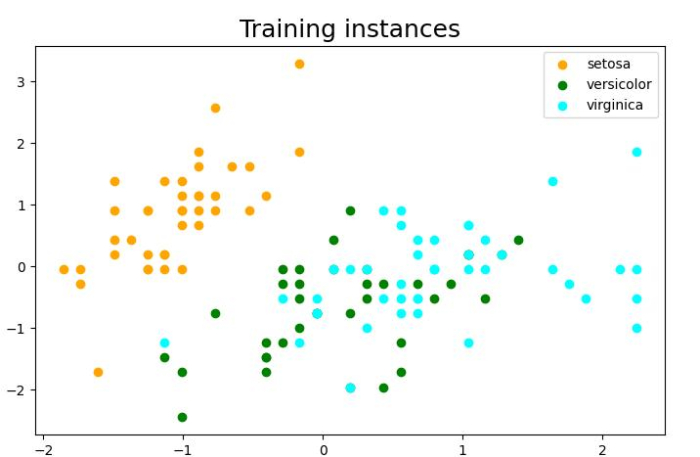
Step 3 ? Plot the training instances using matplotlib. Although this step is optional, it is good practice to plot the instances for more clarity.
Step 4 ? Create object of the SGD classifier, initialize its parameters and train the model using fit() method.
Step 5 ? Evaluate the result by using the metrics package of Python Scikit-learn library.
Example
Let's check the example below in which we will be predicting Iris flower species using its two features namely sepal width and sepal length ?
# Import required libraries
import sklearn
import numpy as np
import matplotlib.pyplot as plt
# %matplotlib inline

# Loading Iris flower dataset
from sklearn import datasets
iris = datasets.load_iris()
X_data, y_data = iris.data, iris.target

# Print iris data shape
print ("Original Dataset Shape:",X_data.shape, y_data.shape)

# Dividing dataset into training and testing dataset and standarized the features
from sklearn.model_selection import train_test_split
from sklearn.preprocessing import StandardScaler

# Getting the Iris dataset with only the first two attributes
X, y = X_data[:,:2], y_data

# Split the dataset into a training and a testing set(20 percent)
X_train, X_test, y_train, y_test = train_test_split(X, y, test_size=0.20, random_state=1)
print ("\nTesting Dataset Shape:", X_train.shape, y_train.shape)

# Standarize the features
scaler = StandardScaler().fit(X_train)
X_train = scaler.transform(X_train)
X_test = scaler.transform(X_test)

# Plot the dataset
# Set the figure size
plt.figure(figsize=(7.16, 3.50))
plt.subplots_adjust(bottom=0.05, top=0.9, left=0.05, right=0.95)
plt.title('Training instances', size ='18')
colors = ['orange', 'green', 'cyan']
for i in range(len(colors)):
   px = X_train[:, 0][y_train == i]
   py = X_train[:, 1][y_train == i]
   plt.scatter(px, py, c=colors[i])

plt.legend(iris.target_names)
plt.xlabel('Sepal length')
plt.ylabel('Sepal width')
plt.show()

# create the linear model SGDclassifier
from sklearn.linear_model import SGDClassifier
linear_clf = SGDClassifier()

# Train the classifier using fit() function
linear_clf.fit(X_train, y_train)

# Print the learned coeficients
print ("\nThe coefficients of the linear boundary are:", linear_clf.coef_)
print ("\nThe point of intersection of the line are:",linear_clf.intercept_)

# Evaluate the result
from sklearn import metrics
y_train_pred = linear_clf.predict(X_train)
print ("\nThe Accuracy of our classifier is:", metrics.accuracy_score(y_train, y_train_pred)*100)
Output
It will produce the following output
Original Dataset Shape: (150, 4) (150,)

Testing Dataset Shape: (120, 2) (120,)

The coefficients of the linear boundary are: [[-28.85486061 13.42772422]
[ 2.54806641 -5.04803702]
[ 7.03088805 -0.73391906]]

The point of intersection of the line are: [-19.61738307 -3.54055412 -0.35387805]
The Accuracy of our classifier is: 76.66666666666667


