 Data Structure
 Networking
 RDBMS
RDBMS Operating System
 Java
Java MS Excel
 iOS
iOS HTML
HTML CSS
CSS Android
 Python
 C Programming
 C++
C++ C#
C# MongoDB
 MySQL
MySQL Javascript
 PHP
PHP
- Selected Reading
- UPSC IAS Exams Notes
- Developer's Best Practices
- Questions and Answers
- Effective Resume Writing
- HR Interview Questions
- Computer Glossary
- Who is Who
How to implement Random Projection using Python Scikit-learn?
Random projection is a dimensionality reduction and data visualization method to simplify the complexity of highly dimensional data. It is basically applied to the data where other dimensionality reduction techniques such as Principal Component Analysis (PCA) can not do the justice to data.
Python Scikit-learn provides a module named sklearn.random_projection that implements a computationally efficient way to reduce the data dimensionality. It implements the following two types of an unstructured random matrix ?
- Gaussian Random Matrix
- Sparse Random Matrix
Implementing Gaussian Random Projection
For implementing Gaussian random matrix, random_projection module uses GaussianRandomProjection() function which reduces the dimensionality by projecting the original space on a randomly generated matrix.
Example
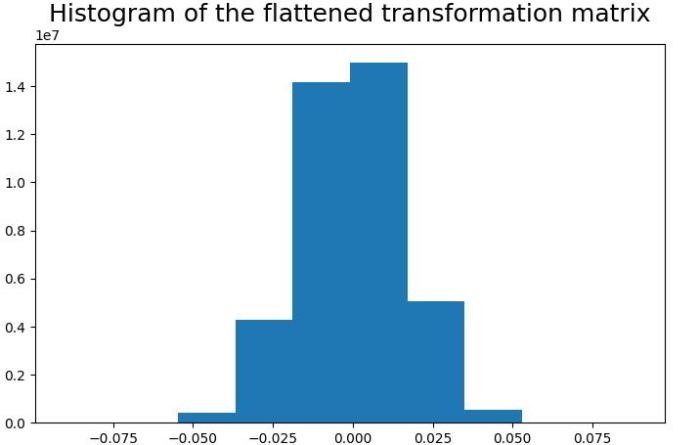
Let's see an example in which we use the Gaussian random projection transformer and visualize the values of the projection matrix as a histogram ?
# Importing the necessary packages
import sklearn
from sklearn.random_projection import GaussianRandomProjection
import numpy as np
from matplotlib import pyplot as plt

# Random data and its transformation
X_random = np.random.RandomState(0).rand(100, 10000)
gauss_data = GaussianRandomProjection(random_state=0)
X_transformed = gauss_data.fit_transform(X_random)

# Get the size of the transformed data
print('Shape of transformed data is: ' + str(X_transformed.shape))

# Set the figure size
plt.figure(figsize=(7.50, 3.50))
plt.subplots_adjust(bottom=0.05, top=0.9, left=0.05, right=0.95)

# Histogram for visualizing the elements of the transformation matrix
plt.hist(gauss_data.components_.flatten())
plt.title('Histogram of the flattened transformation matrix', size ='18')
plt.show()
Output
It will produce the following output
Shape of transformed data is: (100, 3947)

Implementing Sparse Random Projection
For implementing Sparse random matrix, random_projection module uses GaussianRandomProjection() function which reduces the dimensionality by projecting the original space on a sparse random matrix.
Example
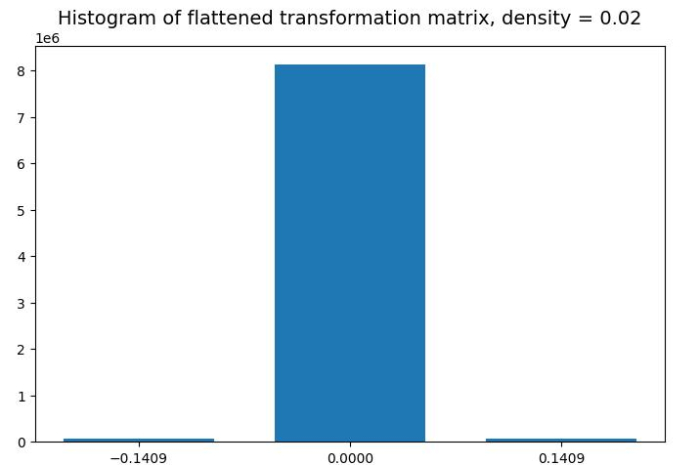
Let's see an example in which we use the Sparse random projection transformer and visualize the values of projection matrix as a histogram
# Importing the necessary packages
import sklearn
from sklearn.random_projection import SparseRandomProjection
import numpy as np
from matplotlib import pyplot as plt

# Random data and its Sparse transformation
rng = np.random.RandomState(42)
X_rand = rng.rand(25, 3000)
sparse_data = SparseRandomProjection(random_state=0)
X_transformed = sparse_data.fit_transform(X_rand)

# Get the size of the transformed data
print('Shape of transformed data is: ' + str(X_transformed.shape))

# Getting data of the transformation matrix and storing it in s.
s = sparse_data.components_.data
total_elements = sparse_data.components_.shape[0] *\
sparse_data.components_.shape[1]
pos = s[s>0][0]
neg = s[s<0][0]
print('Shape of transformation matrix is: '+ str(sparse_data.components_.shape))
counts = (sum(s==neg), total_elements - len(s), sum(s==pos))

# Set the figure size
plt.figure(figsize=(7.16, 3.50))
plt.subplots_adjust(bottom=0.05, top=0.9, left=0.05, right=0.95)

# Histogram for visualizing the elements of the transformation matrix
plt.bar([neg, 0, pos], counts, width=0.1)
plt.xticks([neg, 0, pos])
plt.suptitle('Histogram of flattened transformation matrix, ' +
   'density = ' +
   '{:.2f}'.format(sparse_data.density_), size='14')
plt.show()
Output
It will produce the following output ?
Shape of transformed data is: (25, 2759)
Shape of transformation matrix is: (2759, 3000)


