 Data Structure
 Networking
 RDBMS
RDBMS Operating System
 Java
Java MS Excel
 iOS
iOS HTML
HTML CSS
CSS Android
 Python
 C Programming
 C++
C++ C#
C# MongoDB
 MySQL
MySQL Javascript
 PHP
PHP
- Selected Reading
- UPSC IAS Exams Notes
- Developer's Best Practices
- Questions and Answers
- Effective Resume Writing
- HR Interview Questions
- Computer Glossary
- Who is Who
How to display text on Boxplot in Python?
A boxplot, also known as a box-and-whisker plot, is a graphical representation of a dataset that displays the median, quartiles, and outliers of the data. The box represents the interquartile range (IQR), which is the range between the 25th and 75th percentiles of the data. The median is shown as a line within the box. The whiskers extend from the box to show the range of the data, excluding outliers. Outliers, which are data points that fall outside of the whiskers, are typically shown as individual points or asterisks. Boxplots are useful for summarizing the distribution of a dataset and identifying any outliers or skewness. They are commonly used in statistics, data analysis, and machine learning.
Matplotlib is a powerful plotting library for Python that allows users to create a wide range of static, interactive, and animated visualizations in Python. It provides low-level control over individual elements of a chart or figure and is highly customizable. The seaborn library sits on top of Matplotlib with more added features. It provides a more concise and user-friendly API for creating statistical visualizations in Python, with a focus on exploring relationships between variables and showing distributions of data.
With the help of Seaborn's assortment of pre-made themes and color schemes, it's simple to produce charts with a polished appearance. Both libraries offer functions for creating boxplots, which are useful for visualizing the distribution of data, as well as identifying outliers and skewness in the data.
Syntax
To display text on boxplot in Python, you need to follow the following syntax ?
matplotlib.pyplot.text(x, y, text)
matplotlib.pyplot.text(x, y, text) is a function in the Matplotlib Python library that adds text to the plot at the specified x and y coordinates.
The function takes three arguments: x and y coordinates where the text is placed, and text, which is the actual text that is displayed on the plot. By default, the text is left-aligned and centered vertically with respect to the specified coordinates.
Example
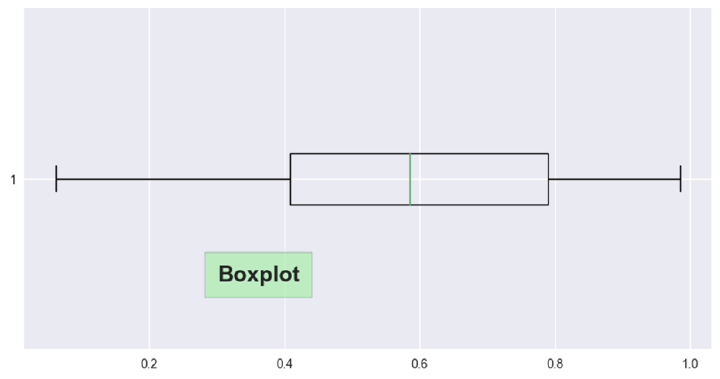
The code imported the necessary libraries, such as pandas, matplotlib, seaborn, and numpy. It set the style of the plots to 'seaborn'. It then created a DataFrame with random values of shape (25,4) and assigned column names as 'A', 'B', 'C', and 'D'.
A figure of size (10,5) was then created using matplotlib. A boxplot was generated for the 'B' column of the DataFrame with the option to show the plot horizontally.
A text box was added to the plot using the matplotlib.pyplot.text() function, with the text 'Boxplot', fontsize 18, and bold fontweight. The function can take many optional arguments such as color, alpha, backgroundcolor, bbox, clip_box, clip_on, clip_path, fontfamily, fontname, fontproperties, fontstyle, fontvariant, fontweight, horizontalalignment, label, linespacing, multialignment, name, path_effects, picker, position, rotation, rotation_mode, size, sketch_params, snap, text, transform, url, usetex, verticalalignment, visible, wrap, x, y, zorder etc.
The bbox parameter defined the properties of the box surrounding the text with light green facecolor, padding of 10, and alpha of 0.5. Finally, the plot was displayed using plt.show().
import pandas as pd
import matplotlib.pyplot as plt
import seaborn as sns
import numpy as np
plt.style.use('seaborn')

df = pd.DataFrame(np.random.rand(25, 4), columns=['A', 'B', 'C', 'D'])
plt.figure(figsize=(10, 5))
plt.boxplot(df['B'], vert=False)

plt.text(0.3, 0.7, 'Boxplot', fontsize=18, fontweight='bold', bbox={'facecolor': 'lightgreen', 'pad': 10, 'alpha': 0.5})
plt.show()
Output

Example
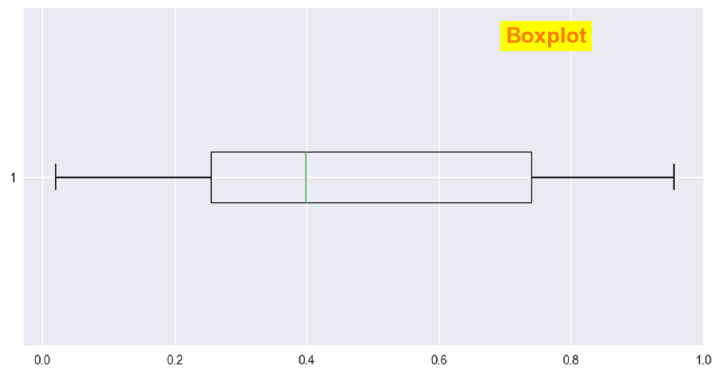
In this code, we imported pandas, numpy, matplotlib.pyplot, and seaborn. We set the style of the plot to "seaborn". We created a DataFrame using numpy with 25 rows and 4 columns labeled A, B, C, and D.
Next, we created a figure with a size of 10 by 5 using plt.figure(). We created a boxplot of the data in column 'A' of the DataFrame by calling plt.boxplot(df['A'], vert=False). This created a horizontal boxplot of the column 'A' with the 'vert' parameter set to False.
A text to the plot using plt.text() is added, where we specified the position of the text with the x and y parameters, the text to be displayed, the font size, font weight, text color, alpha level, and background color. We set the text to be displayed at position (0.7, 1.4) with the text 'Boxplot', font size 18, font weight set to bold, text color set to red, alpha level set to 0.5, and background color set to yellow.
Finally, we displayed the plot using plt.show().
import pandas as pd
import matplotlib.pyplot as plt
import seaborn as sns
import numpy as np
plt.style.use('seaborn')

df = pd.DataFrame(np.random.rand(25, 4), columns=['A', 'B', 'C', 'D'])

plt.figure(figsize=(10, 5))
plt.boxplot(df['A'], vert=False)
plt.text(0.7, 1.4, 'Boxplot', fontsize=18, fontweight='bold', color='red', alpha=0.5, backgroundcolor='yellow')
plt.show()
Output

Conclusion
We learned how to display text on Boxplot in Python. Displaying text on boxplots can be advantageous for providing additional information about the distribution being shown. Text can be used to label the plot, highlight key features such as outliers, or provide contextual information to aid in interpretation. Additionally, labeling outliers or extreme values can help draw attention to these points and potentially provide insights into the data. Overall, displaying text on boxplots can improve the clarity and effectiveness of the visualization for communication and interpretation of the data.

