 Data Structure
 Networking
 RDBMS
RDBMS Operating System
 Java
Java MS Excel
 iOS
iOS HTML
HTML CSS
CSS Android
 Python
 C Programming
 C++
C++ C#
C# MongoDB
 MySQL
MySQL Javascript
 PHP
PHP
- Selected Reading
- UPSC IAS Exams Notes
- Developer's Best Practices
- Questions and Answers
- Effective Resume Writing
- HR Interview Questions
- Computer Glossary
- Who is Who
How to display multiple images in one figure correctly in matplotlib?
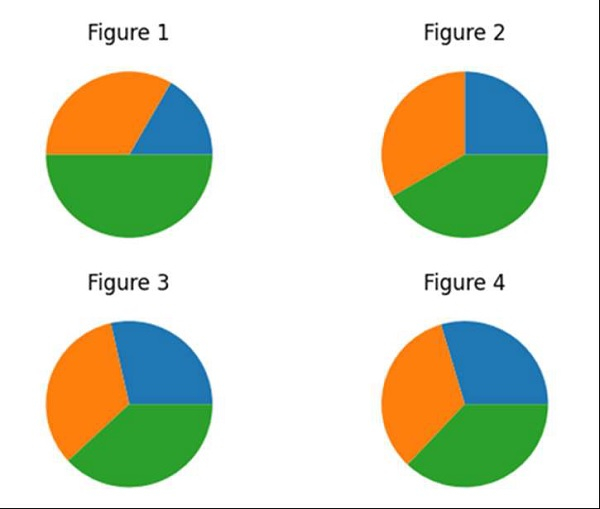
To display multiple images in one figure, we can follow the steps given below −
Initialize the number of rows and cols. nrows*ncols subplot will be created in the current figure. nrows = 2 and ncols = 2, i.e., 2*2 = 4 subplots can be created.
Now add the figures at different indices from 1 to 4.
Use plt.subplot(2, 2, 1) to add new images, i.e., pie at index 1.
To plot a pie chart, pass a list of numbers. Pie charts will be split into the size of list and %age section will depend upon the values in the list.
Set the title of the subplot, i.e., “Figure 1”.
Use plt.subplot(2, 2, 2) to add new images, i.e., pie at index 2.
Use plt.pie() to create a new pie chart.
Set the title of the subplot, i.e., “Figure 2”.
Use plt.subplot(2, 2, 3) to add new images i.e., pie at index 3.
Use plt.pie() to create a new pie chart.
Set the title of the subplot i.e., “Figure 3”.
Use plt.subplot(2, 2, 4) to add new images i.e., pie at index 4.
Use plt.pie() to create a new pie chart.
Set the title of the subplot i.e., “Figure 4”.
Use plt.show(), to show the figure.
Example
import matplotlib.pyplot as plt

rows, cols = 2, 2
plt.subplot(rows, cols, 1)
plt.pie([1, 2, 3])
plt.title("Figure 1")
plt.subplot(rows, cols, 2)
plt.pie([3, 4, 5])
plt.title("Figure 2")
plt.subplot(rows, cols, 3)
plt.pie([6, 7, 8])
plt.title("Figure 3")
plt.subplot(rows, cols, 4)
plt.pie([8, 9, 10])
plt.title("Figure 4")

plt.show()
Output


