
Article Categories
- All Categories
-
 Data Structure
-
 Networking
-
 RDBMS
RDBMS
-
 Operating System
-
 Java
Java
-
 MS Excel
-
 iOS
iOS
-
 HTML
HTML
-
 CSS
CSS
-
 Android
-
 Python
-
 C Programming
-
 C++
C++
-
 C#
C#
-
 MongoDB
-
 MySQL
MySQL
-
 Javascript
-
 PHP
PHP
-
 Economics & Finance
Selected Reading
How to create a predictive linear regression line for a range of independent variable in base R?
If we want to create a regression line inside scatterplot then lines function can be used with the linear model function lm but if we want to do it for a particular range of independent variable then this range needs to be defined and passed within the lines function. Check out the below example of linear regression model that considers a range of independent variable for prediction.
Consider the below vectors −
Example
strsplit(x6,"[*]")
Output
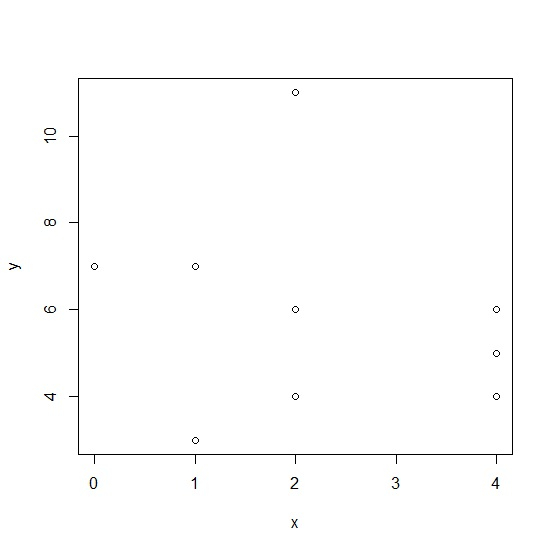
Defining the range of x −
Range_of_x <-data.frame(x=1:3)
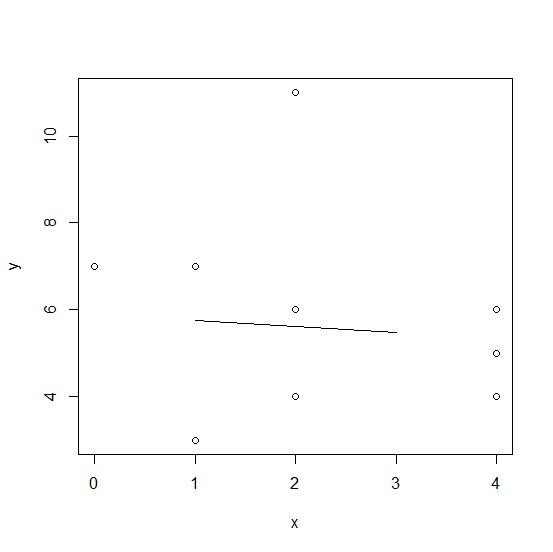
Adding the regression line for the prediction of range of x values −
Example
lines(Range_of_x$x,predict(lm(y~x),Range_of_x))

Updated on: 2020-10-16T14:51:13+05:30
381 Views

Advertisements