
Article Categories
- All Categories
-
 Data Structure
-
 Networking
-
 RDBMS
RDBMS
-
 Operating System
-
 Java
Java
-
 MS Excel
-
 iOS
iOS
-
 HTML
HTML
-
 CSS
CSS
-
 Android
-
 Python
-
 C Programming
-
 C++
C++
-
 C#
C#
-
 MongoDB
-
 MySQL
MySQL
-
 Javascript
-
 PHP
PHP
-
 Economics & Finance
Selected Reading
How to add a regression line to a plot in base R if intercept and slope are given?
To add a regression line to a plot in base R if intercept and slope are given, we can follow the below steps −
- First of all, create two vectors and the scatterplot between them.
- Then, use abline function to create the regression line with intercept and slope given by a and b respectively.
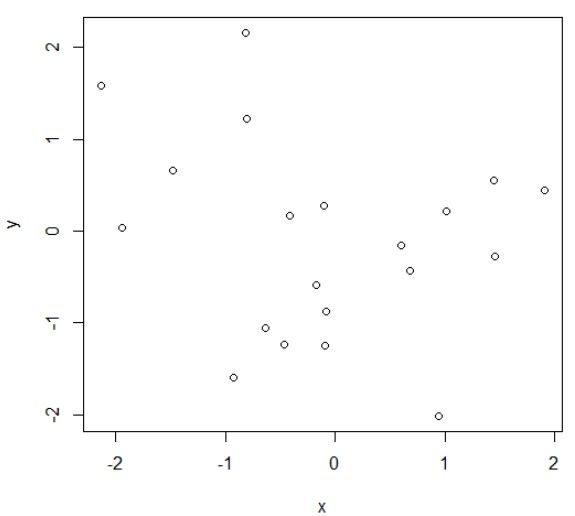
Create the vectors and scatterplot
Use plot functions to create scatterplot between two random vectors x and y −
> x<-round(rnorm(20),2)
> y<-round(rnorm(20),2)
> plot(x,y)
Output
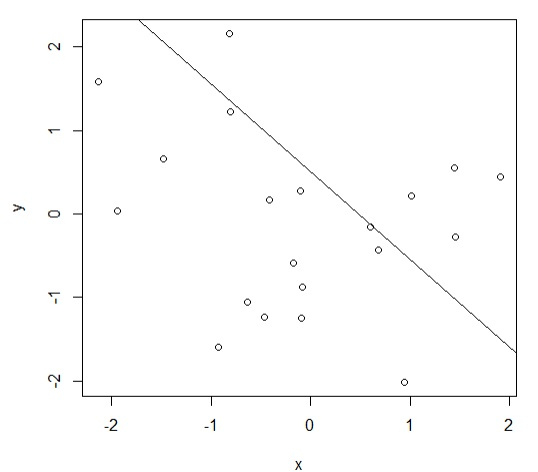
Add regression line with given intercept and slope
Example
Using abline function to add the regression line to the scatterplot with given intercept a = 0.51 and slope = -1.05 −
> x<-round(rnorm(20),2)
> y<-round(rnorm(20),2)
> plot(x,y)
> abline(a=0.51,b=-1.05)
Output

Updated on: 2026-03-11T22:50:57+05:30
2K+ Views

Advertisements