
Article Categories
- All Categories
-
 Data Structure
-
 Networking
-
 RDBMS
RDBMS
-
 Operating System
-
 Java
Java
-
 MS Excel
-
 iOS
iOS
-
 HTML
HTML
-
 CSS
CSS
-
 Android
-
 Python
-
 C Programming
-
 C++
C++
-
 C#
C#
-
 MongoDB
-
 MySQL
MySQL
-
 Javascript
-
 PHP
PHP
Selected Reading
Create scatterplot for two dependent variables and one independent variable in R.
To create scatterplot for two dependent variables and one independent variable, we can use geom_point function and geom_smooth function of ggplot2 package. Both of these functions will be used twice, where we can define the aesthetics of the plot for each dependent variable as shown in the Example below.
Example
Following snippet creates a sample data frame −
x<-rnorm(20)
y1<-rnorm(20,5)
y2<-rnorm(20,10)
df<-data.frame(x,y1,y2)
df
The following dataframe is created −
            x       y1       y2
 1  2.4995751 5.515944 11.055437
 2 -0.6271148 6.234058 9.847844
 3  1.5572278 4.363662 10.305286
 4  0.7544594 4.660968 9.709750
 5 -0.3531405 5.896566 8.300061
 6  0.3516249 6.714057 10.735020
 7  0.4605740 4.955006 8.975519
 8  0.2999492 4.671082 10.373543
 9  1.0682999 4.590270 11.436856
10  0.2140709 5.163876 9.100128
11 -0.3508677 4.798086 9.221152
12  0.6303074 4.879782 10.123158
13 -1.0964767 4.678353 9.703888
14 -1.0814789 4.701568 10.983667
15  0.3777337 4.694484 11.089179
16  0.9787944 5.577403 8.935059
17 -0.2456083 6.365431 9.195587
18 -1.1495510 3.654495 7.648289
19  0.1903006 7.930433 11.254847
20  0.6788355 4.661313 11.421257
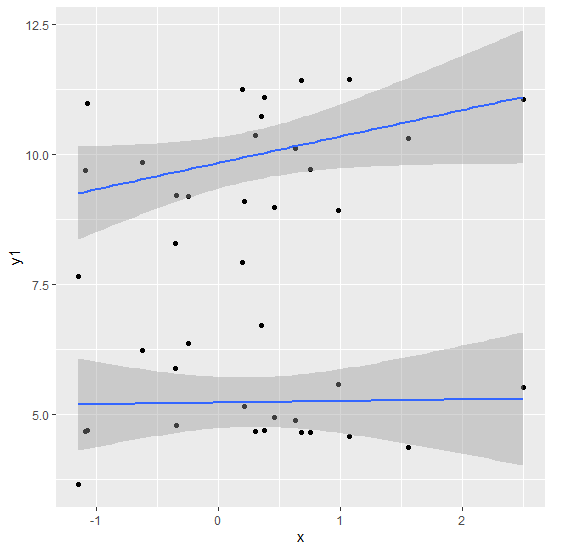
To load the ggplot2 package and to create a scatterplot for dependent variables y1 and y2 that has only one independent variable x on the above created data frame, add the following code to the above snippet −
x<-rnorm(20)
y1<-rnorm(20,5)
y2<-rnorm(20,10)
df<-data.frame(x,y1,y2)
library(ggplot2)

ggplot(df,aes(x,y1))+geom_point()+geom_smooth(method="lm")+geom_point(aes(x,y2)
)+geom_smooth(aes(x,y2),method="lm")
`geom_smooth()` using formula 'y ~ x'
`geom_smooth()` using formula 'y ~ x'
Output
If you execute all the above given snippets as a single program, it generates the following Output −

Updated on: 2021-11-11T04:40:13+05:30
2K+ Views

Advertisements