 Data Structure
 Networking
 RDBMS
RDBMS Operating System
 Java
Java MS Excel
 iOS
iOS HTML
HTML CSS
CSS Android
 Python
 C Programming
 C++
C++ C#
C# MongoDB
 MySQL
MySQL Javascript
 PHP
PHP
- Selected Reading
- UPSC IAS Exams Notes
- Developer's Best Practices
- Questions and Answers
- Effective Resume Writing
- HR Interview Questions
- Computer Glossary
- Who is Who
How to Create a Candlestick Chart in Matplotlib?
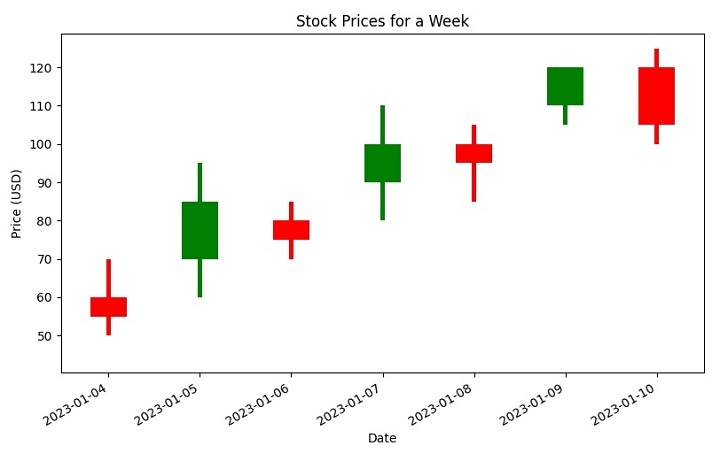
Candlestick charts are a popular way to visualize stock market data. They show the opening, closing, high, and low prices of a stock or security for a given time period. A candlestick chart consists of a series of vertical bars or "candlesticks", where each candlestick represents one time period. The top and bottom of each candlestick represent the highest and lowest prices traded during that period, while the body of the candlestick represents the opening and closing prices.
In this tutorial, we will explore codes where we will use Matplotlib, a popular data visualization library in Python, to create a candlestick chart for a week of stock prices.
We will use the Pandas library to create a DataFrame representing the stock prices and then use Matplotlib's bar chart function to plot the candlesticks.
To create a candlestick chart, we use a specific syntax that involves using the plt.bar method in Matplotlib.
plt.bar to Create Bar Charts
plt.bar is a function in the Matplotlib library that allows you to create bar charts in Python. It takes several parameters, including the x-axis values, y-axis values, width of the bars, and colour of the bars. You can use this function to create both horizontal and vertical bar charts, and you can customize the appearance of the bars to suit your needs.
Below is the syntax for plt.bar.
plt.bar(up.index,up.close-up.open,bottom=up.open,color)
The "up" dataframe contains the stock prices where the closing price is greater than or equal to the opening price.

plt.bar(down.index, down.close - down.open, bottom=down.open, color)
The "down" dataframe contains the stock prices where the closing price is less than the opening price.
Example: Candlestick Chart in Matplotlib
Now let's explore the code shown below. This code creates a candlestick chart to represent the opening, closing, high, and low prices of a stock for a week using the matplotlib library in Python.
First, a Pandas DataFrame is created to store the stock prices of the week. Then, two new DataFrames are created - "up" stores the stock prices where the closing stock price is greater than or equal to the opening stock price, and "down" stores the stock prices where the closing stock price is lesser than the opening stock price.
Next, the colours for the candlesticks are defined: "green" for increased stock prices and "red" for decreased stock prices. The width of the candlestick elements is also set.
Then, the plt.bar method is used to plot the up and down stock prices on the chart, where the bottom parameter specifies the starting point of each bar. The x-axis tick labels are rotated by 45 degrees towards the right for better visibility. Finally, the chart is labelled with a title, x-label, y-label, and displayed using plt.show().
import pandas as pd
import matplotlib.pyplot as plt

# Create a DataFrame to represent opening, closing, high, and low prices
# of a stock for a week
stock_prices = pd.DataFrame({'open': [60, 70, 80, 90, 100, 110, 120],
   'close': [55, 85, 75, 100, 95, 120, 105],
   'high': [70, 95, 85, 110, 105, 120, 125],
   'low': [50, 60, 70, 80, 85, 105, 100]},
   index=pd.date_range("2023-04-01", periods=7, freq="d"))

plt.figure()

# Create a new DataFrame called "up" that stores the stock_prices
# when the closing stock price is greater than or equal to the opening stock price
up = stock_prices[stock_prices.close >= stock_prices.open]

# Create a new DataFrame called "down" that stores the stock_prices
# when the closing stock price is lesser than the opening stock price
down = stock_prices[stock_prices.close < stock_prices.open]

# When the stock prices have decreased, then it
# will be represented by red color candlestick
col1 = 'red'

# When the stock prices have increased, then it
# will be represented by green color candlestick
col2 = 'green'

# Set the width of candlestick elements
width = 0.4
width2 = 0.05

# Plot the up prices of the stock
plt.bar(up.index, up.close-up.open, width, bottom=up.open, color=col2)
plt.bar(up.index, up.high-up.close, width2, bottom=up.close, color=col2)
plt.bar(up.index, up.low-up.open, width2, bottom=up.open, color=col2)

# Plot the down prices of the stock
plt.bar(down.index, down.close-down.open, width, bottom=down.open, color=col1)
plt.bar(down.index, down.high-down.open, width2, bottom=down.open, color=col1)
plt.bar(down.index, down.low-down.close, width2, bottom=down.close, color=col1)

# Rotate the x-axis tick labels at 45 degrees towards right
plt.xticks(rotation=45, ha='right')

# Display the candlestick chart of stock data for a week
plt.title('Stock Prices for a Week')
plt.xlabel('Date')
plt.ylabel('Price (USD)')
plt.show()
Output
On executing, you will get the following candlestick chart:

Conclusion
In conclusion, creating a candlestick chart in Matplotlib can be a powerful tool for visualizing stock market data. Through the use of different colours and widths, it is also possible to convey additional information about how stock prices have changed over time. By following the steps outlined in this tutorial, you can create your own candlestick chart and gain deeper insights into market trends and stock performance.

