 Data Structure
 Networking
 RDBMS
RDBMS Operating System
 Java
Java MS Excel
 iOS
iOS HTML
HTML CSS
CSS Android
 Python
 C Programming
 C++
C++ C#
C# MongoDB
 MySQL
MySQL Javascript
 PHP
PHP
- Selected Reading
- UPSC IAS Exams Notes
- Developer's Best Practices
- Questions and Answers
- Effective Resume Writing
- HR Interview Questions
- Computer Glossary
- Who is Who
Plot candlestick chart using mplfinance module in python
In the world of financial analysis, candlestick charts are an essential tool for visualizing stock price data which can be plotted using mplfinance module in python. They provide valuable insights into market trends and patterns.
By harnessing the capabilities of mplfinance, developers can generate visually compelling candlestick charts with ease. In this article, we will explore how to leverage the mplfinance module to create stunning and insightful candlestick charts effortlessly.
mplfinance module
The mplfinance is a Python module specifically designed for visualizing financial market data using candlestick charts. It provides an intuitive and flexible interface for creating highly customizable and interactive plots.
The module offers a wide range of features to enhance the representation of financial data, including the ability to incorporate volume bars, moving averages, and technical indicators into the candlestick charts. The mplfinance module supports various chart types, such as OHLC (open-high-low-close), line plots, and even scatter plots.
The mplfinance module also offers extensive customization options, allowing you to modify colors, fonts, gridlines, annotations, and more. Additionally, it provides functionality to handle non-trading days and gaps in data.
Below is the code to install mplfinance module ?
pip install mplfinance
What is a candlestick chart?
A candlestick chart is a popular and widely used charting technique in financial analysis. It visualizes the price movement of an asset, such as stocks, over a specified period of time. Each candlestick represents a single trading period, such as a day, week, or month.
The candlestick is composed of four main elements: ?open, close, high, and low prices. The body of the candlestick represents the price range between the open and closed prices, with different colors indicating whether the price increased or decreased during that period. The high and low prices are represented by thin lines called wicks or shadows.
Candlestick charts provide valuable information about market sentiment and trends. Traders and analysts use them to identify patterns and signals, such as bullish or bearish reversals, trend continuations, and support/resistance levels. They offer a visual representation of price action, aiding in decision-making and market analysis.
How to plot a candlestick chart using the mplfinance module in Python?
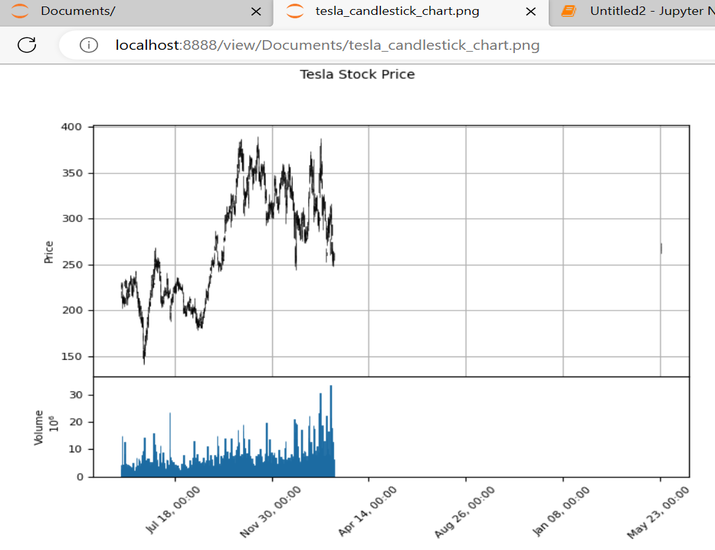
Below are the steps that we will follow to plot candlestick chart using mplfinance module in python using tesla stock price dataset ?
Import the necessary libraries: `mplfinance`, `pandas`, `numpy`, and `matplotlib.pyplot`.
Load the Tesla stock data from a CSV file using `pd.read_csv()`. Parse the 'date' column as dates and set it as the index of the DataFrame.
Convert the 'volume' column to numeric using `pd.to_numeric()`. Handle any non-numeric values by replacing them with 0.
Create a custom style for the plot using `mpf.make_mpf_style()`. Use the 'default' base style and set the font size to 8.
Create a new figure and set the title, y-axis label, and lower y-axis label using `mpf.plot()`. Pass the data DataFrame, specify the chart type as 'candle', enable volume bars, and set the desired plot attributes.
Retrieve the axis objects from the returned list. In this case, we access the first axis object using `axes[0]`.
Customize the appearance of the plot. Enable grid lines on the plot by setting `ax.grid(True)`.
Save the plot as an image file using `fig.savefig()`.
Show the plot on the screen using `mpf.show()`.
Below is the program to plot candlestick chart using the mplfinance module in python using the tesla stock price dataset following the above steps ?
Example
#import all the necessary libraries and modules
import mplfinance as mpf
import pandas as pd
import numpy as np
import matplotlib.pyplot as plt

# Load the Tesla stock data from a CSV file (or any other data source)
data = pd.read_csv('tesla-stock-price.csv', parse_dates=['date'])
data = data.set_index('date')

# Convert 'volume' column to numeric, handle non-numeric values
data['volume'] = pd.to_numeric(data['volume'], errors='coerce')
non_numeric_values = data['volume'].isnull()
if non_numeric_values.any():
   data['volume'] = np.where(non_numeric_values, 0, data['volume'])

# Create a style with adjusted font size
style = mpf.make_mpf_style(base_mpl_style='default', rc={'font.size': 8})  # Set the font size here

# Create a new figure and set the title
fig, axes = mpf.plot(data, type='candle', volume=True,
   title='Tesla Stock Price', ylabel='Price', ylabel_lower='Volume',
   show_nontrading=True, returnfig=True, style=style)
plt.style.use('dark_background')

# Retrieve the axis objects from the returned list
ax = axes[0]

# Customize the appearance of the plot
ax.grid(True)  # Display grid lines

# Save the plot to an image file
fig.savefig('tesla_candlestick_chart.png')

# Show the plot on the screen
mpf.show()
Output

Conclusion
In conclusion, plotting candlestick charts using the mplfinance module in Python offers a powerful tool for visualizing and analyzing financial market data. By leveraging mplfinance's user-friendly interface, customizable features, and extensive charting capabilities, users can effectively interpret stock price trends and patterns.

