 Data Structure
 Networking
 RDBMS
RDBMS Operating System
 Java
Java MS Excel
 iOS
iOS HTML
HTML CSS
CSS Android
 Python
 C Programming
 C++
C++ C#
C# MongoDB
 MySQL
MySQL Javascript
 PHP
PHP
- Selected Reading
- UPSC IAS Exams Notes
- Developer's Best Practices
- Questions and Answers
- Effective Resume Writing
- HR Interview Questions
- Computer Glossary
- Who is Who
How to change the default matplotlib plot to seaborn plot?
Changing the default matplotlib plot settings to Seaborn involves modifying the default plot parameters to match the style and aesthetics provided by Seaborn. This can be achieved by adjusting various elements such as the color palette, gridlines, font styles, and plot themes. Here's a step-by-step guide to changing the default matplotlib plot to a Seaborn plot in detail.
Import the necessary libraries
To get started, import the required libraries such as 'matplotlib.pyplot' for creating plots and 'seaborn' for applying Seaborn styles and aesthetics. The following is the code to import the libraries.
import matplotlib.pyplot as plt
import seaborn as sns
Apply the Seaborn style
To change the default plot settings to Seaborn, apply the Seaborn style using the 'set()' function. This will modify the default parameters of 'matplotlib' to match the Seaborn style.
sns.set()
Customize the color palette
Seaborn provides several color palettes that can be used to customize the color scheme of your plots. We can choose from various built-in palettes or create your own and to set a specific color palette, we have to use the 'set_palette()' function.
sns.set_palette("color_palette_name")
Replace '"color_palette_name"' with the desired palette name, such as '"deep"', '"pastel"', '"dark"' or any other available palette.
Customize gridlines and axes
Seaborn provides options to customize gridlines and axes. To remove gridlines, use the 'despine()' function. By default, it removes the top and right spines. To remove all the spines, use the following code:
sns.despine()
To customize the axes, we can modify properties such as the labels, tick marks, and their appearance. For example, to set custom labels for the x-axis and y-axis, use the 'xlabel()' and 'ylabel()' functions, respectively.
plt.xlabel("X-axis label")
plt.ylabel("Y-axis label")
We can further customize the tick marks and their appearance using 'xticks()' and 'yticks()' functions.
plt.xticks([0, 1, 2, 3, 4])
plt.yticks([0, 1, 2, 3, 4])
Customize fonts and text
Seaborn allows us to customize the fonts and text properties of our plots. To change the font style and size of the plot title, labels, and annotations, use the 'title()', 'xlabel()', 'ylabel()', and 'text()' functions.
plt.title("Plot Title", fontweight="bold", fontsize=12)
plt.xlabel("X-axis Label", fontsize=10)
plt.ylabel("Y-axis Label", fontsize=10)
plt.text(x, y, "Annotation Text", fontsize=8)
Replace the values in the 'fontweight', 'fontsize', and 'fontsize' parameters with our desired values.
Customize plot themes
Seaborn provides different plot themes that can be applied to change the overall appearance of the plot. You can choose from options such as '"darkgrid"', '"whitegrid"', '"dark"', '"white"', or '"ticks"'. To apply a theme, use the 'set_style()' function.
sns.set_style("theme_name")
Replace '"theme_name"' with the desired theme name.
Create and display the plot
After customizing the plot settings to Seaborn style, create our plot using 'matplotlib' functions such as 'plot()', 'scatter()', or 'bar()'. Once our plot is ready, use 'plt.show()' to display the plot.
plt.plot(x, y)
plt.show()
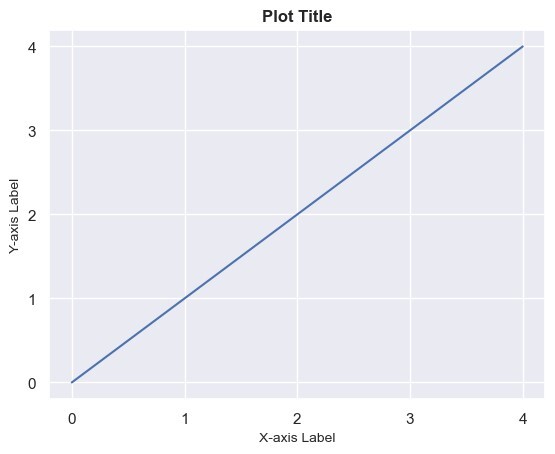
By combining all the mentioned above steps, we can change the default matplotlib plot to a Seaborn plot, applying Seaborn's style, color palette, gridlines, font styles, and plot themes.
Example
import matplotlib.pyplot as plt
import seaborn as sns
x = [0, 1, 2, 3, 4]
y = [0, 1, 2, 3, 4]
sns.set()
sns.set_palette("deep")
sns.despine()
plt.xticks([0, 1, 2, 3, 4])
plt.yticks([0, 1, 2, 3, 4])
plt.title("Plot Title", fontweight="bold", fontsize=12)
plt.xlabel("X-axis Label", fontsize=10)
plt.ylabel("Y-axis Label", fontsize=10)
sns.set_style("darkgrid")
plt.plot(x, y)
plt.show()
Output


