
Article Categories
- All Categories
-
 Data Structure
-
 Networking
-
 RDBMS
RDBMS
-
 Operating System
-
 Java
Java
-
 MS Excel
-
 iOS
iOS
-
 HTML
HTML
-
 CSS
CSS
-
 Android
-
 Python
-
 C Programming
-
 C++
C++
-
 C#
C#
-
 MongoDB
-
 MySQL
MySQL
-
 Javascript
-
 PHP
PHP
-
 Economics & Finance
Selected Reading
How can I change the font size of ticks of axes object in Matplotlib?
To change the font size of ticks of axes object in matplotlib, we can take the following steps −
Create x and y data points using numpy.
Using subplots() method, create a figure and a set of subplots (fig and ax).
Plot x and y data points using plot() method, with color=red and linewidth=5.
Set xticks with x data points.
Get the list of major ticks using get_major_ticks() method.
Iterate the major ticks (from step 5), and set the font size and rotate them by 45 degrees.
To display the figure, use show() method.
Example
import numpy as np
from matplotlib import pyplot as plt
plt.rcParams["figure.figsize"] = [7.00, 3.50]
plt.rcParams["figure.autolayout"] = True
x = np.linspace(-2, 2, 10)
y = np.sin(x)

fig, ax = plt.subplots()

ax.plot(x, y, c='red', lw=5)
ax.set_xticks(x)
for tick in ax.xaxis.get_major_ticks():
   tick.label.set_fontsize(14)
   tick.label.set_rotation('45')

plt.tight_layout()

plt.show()
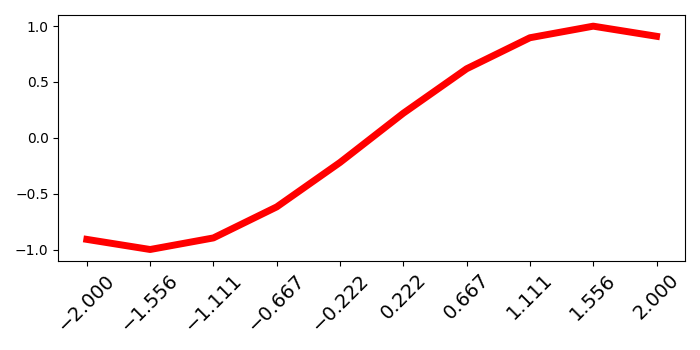
Output

Updated on: 2021-05-08T09:06:39+05:30
862 Views

Advertisements