
Article Categories
- All Categories
-
 Data Structure
-
 Networking
-
 RDBMS
RDBMS
-
 Operating System
-
 Java
Java
-
 MS Excel
-
 iOS
iOS
-
 HTML
HTML
-
 CSS
CSS
-
 Android
-
 Python
-
 C Programming
-
 C++
C++
-
 C#
C#
-
 MongoDB
-
 MySQL
MySQL
-
 Javascript
-
 PHP
PHP
-
 Economics & Finance
Selected Reading
How to plot matplotlib contour?
To plot matplotlib contour, we can take the following steps −
Create data points for x, y and h using numpy.
Using the countourf() method, create a colored 3D (alike) plot.
Using the set_over() method, set the color for high out-of-range values when "norm.clip = False".
Using the set_under() method, set the color for low out-of-range values when "norm.clip = False".
Using the changed() method, call this whenever the mappable is changed to notify all the callbackSM listeners to the "changed" signal.
Use the show() method to display the figure.
Example
import numpy as np
from matplotlib import pyplot as plt
plt.rcParams["figure.figsize"] = [7.50, 3.50]
plt.rcParams["figure.autolayout"] = True
x = np.arange(1, 10)
y = x.reshape(-1, 1)
h = x * y
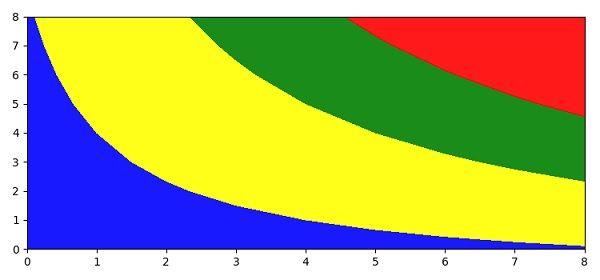
cs = plt.contourf(h, levels=[10, 30, 50], colors=['yellow', 'green', 'purple'], extend='both', alpha=.90)
cs.cmap.set_over('red')
cs.cmap.set_under('blue')
cs.changed()
plt.show()
Output

Updated on: 2021-04-10T07:33:48+05:30
436 Views

Advertisements