
Article Categories
- All Categories
-
 Data Structure
-
 Networking
-
 RDBMS
RDBMS
-
 Operating System
-
 Java
Java
-
 MS Excel
-
 iOS
iOS
-
 HTML
HTML
-
 CSS
CSS
-
 Android
-
 Python
-
 C Programming
-
 C++
C++
-
 C#
C#
-
 MongoDB
-
 MySQL
MySQL
-
 Javascript
-
 PHP
PHP
Selected Reading
How to adjust 'tick frequency' in Matplotlib for string X-axis?
To adjust tick frequency for X-axis, we can take the following steps −
- Set the figure size and adjust the padding between and around the subplots.
- Initialize a variable, N, for number of sample data points.
- Create x and y data points using numpy.
- Plot x and y data points using plot() method.
- Initialize a variable freq_x to adjust the frequency of the xticks.
- Use xticks() method to set the xticks.
- To display the figure, use show() method.
Example
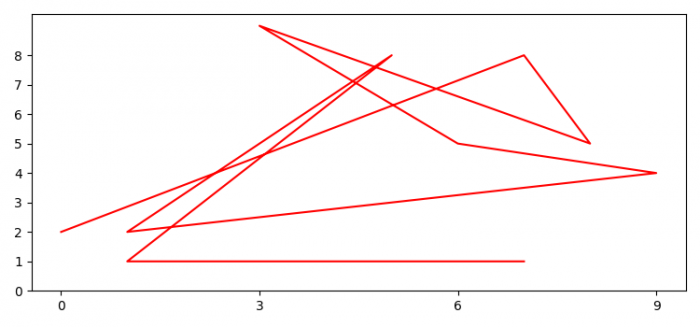
import matplotlib.pyplot as plt
import numpy as np

plt.rcParams["figure.figsize"] = [7.50, 3.50]
plt.rcParams["figure.autolayout"] = True

N = 10

x = np.random.randint(low=0, high=N, size=N)
y = np.random.randint(low=0, high=N, size=N)

plt.plot(x, y, color='red')

freq_x = 3

plt.xticks(np.arange(0, N, freq_x))

plt.show()
Output


Updated on: 2021-08-03T13:09:43+05:30
2K+ Views

Advertisements