 Data Structure
 Networking
 RDBMS
RDBMS Operating System
 Java
Java MS Excel
 iOS
iOS HTML
HTML CSS
CSS Android
 Python
 C Programming
 C++
C++ C#
C# MongoDB
 MySQL
MySQL Javascript
 PHP
PHP
- Selected Reading
- UPSC IAS Exams Notes
- Developer's Best Practices
- Questions and Answers
- Effective Resume Writing
- HR Interview Questions
- Computer Glossary
- Who is Who
How is Seaborn used to group the data by one or more columns?
Seaborn is primarily a data visualization library and does not provide direct methods for grouping data by one or more columns. However, Seaborn works seamlessly with the pandas library, which is a powerful data manipulation library in Python. We can use pandas to group our data by one or more columns, and then use Seaborn to visualize the grouped data.
By combining the data manipulation capabilities of pandas to group our data by one or more columns with the visualization capabilities of Seaborn, we can gain insights from our data and effectively communicate our findings through visualizations.
Here's a detailed explanation of how to use Seaborn in combination with pandas to group data by one or more columns.
Import the necessary libraries
Before grouping the data by one or more columns we have to import all the required libraries such as seaborn and pandas.
import seaborn as sns
import pandas as pd
Load the data into a pandas DataFrame
Next we have to load the dataset into the python environment using the read_csv() function available in pandas library. Let's load the Iris.csv file using the read_csv() function.
df = pd.read_csv("https://gist.githubusercontent.com/netj/8836201/raw/6f9306ad21398ea43cba4f7d537619d0e07d5ae3/iris.csv")
df.head()
Group the data by one or more columns
Pandas provides the 'groupby()' function to group data based on one or more columns. We can specify one or more columns as the grouping criteria and then perform operations on the grouped data.
Example
In this example, we create a 'grouped_data' object that represents the grouped data based on the specified column/columns. This object can be used to perform various operations on the grouped data. Here we applied grouping on single column as well as on multiple columns.
import seaborn as sns
import pandas as pd

df = pd.read_csv("https://gist.githubusercontent.com/netj/8836201/raw/6f9306ad21398ea43cba4f7d537619d0e07d5ae3/iris.csv")
df.head()

# Group data by a single column
grouped_data = df.groupby(['variety'])
# Group data by multiple columns
grouped_data = df.groupby(['sepal.length', 'sepal.width'])
res = grouped_data.head()
print(res)
Output
     sepal.length  sepal.width  petal.length  petal.width    variety
0             5.1          3.5           1.4          0.2     Setosa
1             4.9          3.0           1.4          0.2     Setosa
2             4.7          3.2           1.3          0.2     Setosa
3             4.6          3.1           1.5          0.2     Setosa
4             5.0          3.6           1.4          0.2     Setosa
..            ...          ...           ...          ...        ...
145           6.7          3.0           5.2          2.3  Virginica
146           6.3          2.5           5.0          1.9  Virginica
147           6.5          3.0           5.2          2.0  Virginica
148           6.2          3.4           5.4          2.3  Virginica
149           5.9          3.0           5.1          1.8  Virginica

[150 rows x 5 columns]
Perform operations on the grouped data
Once we have grouped the data, we can perform various operations on the grouped data, such as calculating summary statistics, applying aggregations, or transforming the data.
Example
In this example, we calculate the mean of 'sepal.length' within each group, the sum of ''sepal.width' and 'petal.length' within each group, and apply a custom aggregation function to calculate the range of 'petal.width ' within each group.
mean_values = grouped_data['sepal.length'].mean()
sum_values = grouped_data['sepal.width', 'petal.length'].sum()
custom_agg = grouped_data['petal.width'].agg(lambda x: x.max() - x.min())
Visualize the grouped data using Seaborn
Once we have performed operations on the grouped data, we can use Seaborn to visualize the grouped data. Seaborn provides a wide range of plotting functions that accept pandas DataFrames as input.
We can use various other Seaborn plotting functions to visualize our grouped data, such as box plots, violin plots, point plots, and more. Seaborn provides numerous customization options to enhance the visual representation of our data.
Example
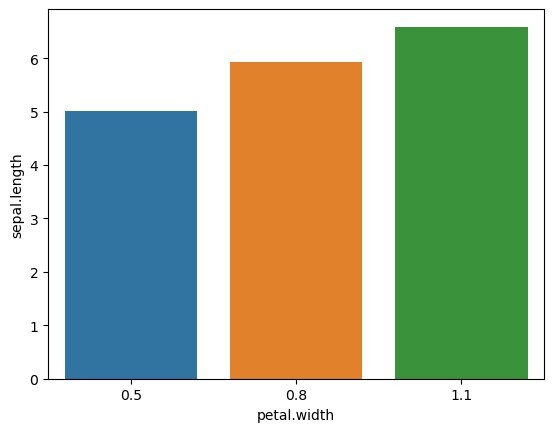
In this example, we use the 'barplot()' function from Seaborn to create a bar plot of the mean values within each group. The 'x' parameter represents the keys of the groups, and the 'y' parameter represents the mean values.
import seaborn as sns
import pandas as pd
import matplotlib.pyplot as plt

df = pd.read_csv("https://gist.githubusercontent.com/netj/8836201/raw/6f9306ad21398ea43cba4f7d537619d0e07d5ae3/iris.csv")
# Group data by a single column
grouped_data = df.groupby(['variety'])
mean_values = grouped_data['sepal.length'].mean()
sum_values = grouped_data['sepal.width', 'petal.length'].sum()
custom_agg = grouped_data['petal.width'].agg(lambda x: x.max() - x.min())
#Create a bar plot of the mean values within each group
sns.barplot(x = custom_agg, y = mean_values)

plt.show()
Output

Note
It's important to note that Seaborn is primarily focused on data visualization, and for more complex data manipulation tasks, we may need to rely on the functionalities provided by pandas or other data manipulation libraries in Python.

