 Data Structure
 Networking
 RDBMS
RDBMS Operating System
 Java
Java MS Excel
 iOS
iOS HTML
HTML CSS
CSS Android
 Python
 C Programming
 C++
C++ C#
C# MongoDB
 MySQL
MySQL Javascript
 PHP
PHP
- Selected Reading
- UPSC IAS Exams Notes
- Developer's Best Practices
- Questions and Answers
- Effective Resume Writing
- HR Interview Questions
- Computer Glossary
- Who is Who
How is Seaborn used to filter and select specific rows or columns from my data?
Seaborn is primarily a data visualization library and does not provide direct methods for filtering or selecting specific rows or columns from your data. However, Seaborn works seamlessly with the pandas library, which is a powerful data manipulation library in Python. We can use pandas to filter and select specific rows or columns from your data, and then use Seaborn to visualize the filtered data.
By combining the data manipulation capabilities of pandas to filter and select specific rows or columns with the visualization capabilities of Seaborn, we can gain insights from our data and effectively communicate our findings through visualizations.
Here's a detailed explanation of how to use Seaborn in combination with pandas to filter and select specific rows or columns from our data.
Import the Necessary Libraries
Firstly, we have to import all the required libraries such as seaborn and pandas in our python environment.
import seaborn as sns
import pandas as pd
Load or create the data into a pandas DataFrame
After importing the required libraries we have to create the data using DataFrame() function of the pandas library or we can load the data using the read_csv() function of the pandas library. By using the below code we can load the data into our python working environment.
Example
import seaborn as sns
import pandas as pd
df = pd.read_csv('https://raw.githubusercontent.com/datasciencedojo/datasets/master/titanic.csv')
df.head()
Output
   PassengerId  Survived  Pclass  ...     Fare Cabin  Embarked
0            1         0       3  ...   7.2500   NaN         S
1            2         1       1  ...  71.2833   C85         C
2            3         1       3  ...   7.9250   NaN         S
3            4         1       1  ...  53.1000  C123         S
4            5         0       3  ...   8.0500   NaN         S

[5 rows x 12 columns]
Filter Rows Based on a Condition
Pandas provides various methods to filter rows based on specific conditions. For example, we can use the 'loc' or 'iloc' accessor to filter rows based on a Boolean condition.
Example
In this example, we use the 'loc' accessor to select rows where the values in the ?Age' column are greater than 10. This will create a new DataFrame called 'filtered_df' containing the filtered rows.
import seaborn as sns
import pandas as pd
df = pd.read_csv('https://raw.githubusercontent.com/datasciencedojo/datasets/master/titanic.csv')
# Filter rows where a column meets a specific condition
filtered_df = df.loc[df['Age'] > 10]
res = filtered_df.head()
print(res)
Output
   PassengerId  Survived  Pclass  ...     Fare Cabin  Embarked
0            1         0       3  ...   7.2500   NaN         S
1            2         1       1  ...  71.2833   C85         C
2            3         1       3  ...   7.9250   NaN         S
3            4         1       1  ...  53.1000  C123         S
4            5         0       3  ...   8.0500   NaN         S

[5 rows x 12 columns]
Select Specific Columns
We can use pandas to select specific columns from our DataFrame. There are multiple ways to do this, such as indexing with column names or using the 'loc' or 'iloc' accessor.
Example
In this example, we create a new DataFrame called 'selected_columns' that contains only the specified columns ('Age' and 'Fare') from the original DataFrame.
import seaborn as sns
import pandas as pd
df = pd.read_csv('https://raw.githubusercontent.com/datasciencedojo/datasets/master/titanic.csv')
# Filter rows where a column meets a specific condition
filtered_df = df.loc[df['Age'] > 10]
# Select specific columns by name
selected_columns = df[['Age', 'Fare']]
# Select specific columns using loc or iloc
selected_columns = df.loc[:,['Age', 'Fare']]
print(selected_columns.head())
Output
    Age     Fare
0  22.0   7.2500
1  38.0  71.2833
2  26.0   7.9250
3  35.0  53.1000
4  35.0   8.0500
Visualize the Filtered or Selected Data Using Seaborn
Once we have filtered or selected the desired rows or columns using pandas, we can use Seaborn to visualize the filtered data. Seaborn provides a wide range of plotting functions that accept pandas DataFrames as input.
We can use various other Seaborn plotting functions to visualize our filtered or selected data, such as line plots, bar plots, box plots, and more. Seaborn provides numerous customization options to enhance the visual representation of our data.
Example
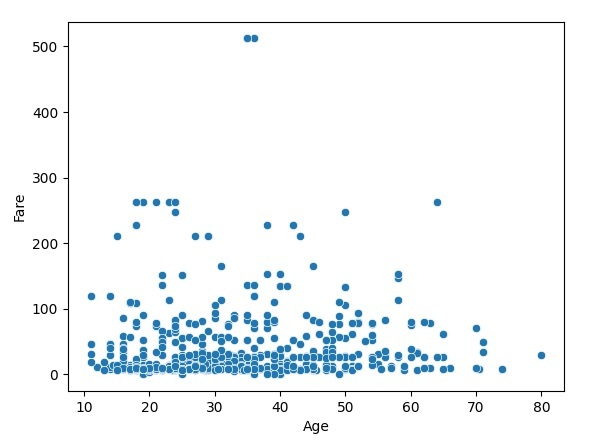
In the above example, we use the 'scatterplot()' function from Seaborn to create a scatter plot of two columns ('Age' and 'Fare') from the 'filtered_df' DataFrame.
import seaborn as sns
import pandas as pd
import matplotlib.pyplot as plt

df = pd.read_csv('https://raw.githubusercontent.com/datasciencedojo/datasets/master/titanic.csv')
# Filter rows where a column meets a specific condition
filtered_df = df.loc[df['Age'] > 10]
# Create a scatter plot of two columns from the filtered DataFrame
sns.scatterplot(x='Age', y='Fare', data=filtered_df)
plt.show()
Output

Note
It's important to note that Seaborn is primarily focused on data visualization, and for more complex data manipulation tasks, we may need to rely on the functionalities provided by pandas or other data manipulation libraries in Python.

