 Data Structure
 Networking
 RDBMS
RDBMS Operating System
 Java
Java MS Excel
 iOS
iOS HTML
HTML CSS
CSS Android
 Python
 C Programming
 C++
C++ C#
C# MongoDB
 MySQL
MySQL Javascript
 PHP
PHP
- Selected Reading
- UPSC IAS Exams Notes
- Developer's Best Practices
- Questions and Answers
- Effective Resume Writing
- HR Interview Questions
- Computer Glossary
- Who is Who
Can Seaborn be used to perform calculations on data, such mean or standard deviation?
Seaborn is primarily a data visualization library and does not provide direct methods for performing calculations on data, such as calculating mean or standard deviation. However, Seaborn works seamlessly with the pandas library, which is a powerful data manipulation library in Python. You can use pandas to perform calculations on your data, and then use Seaborn to visualize the calculated results.
The mean is a statistical measure that represents the average value of a set of numbers. It is calculated by summing up all the numbers in the set and then dividing the sum by the total count of numbers.
Standard deviation is a statistical measure that quantifies the amount of dispersion or variability in a set of values.
By combining the data manipulation capabilities of pandas to perform calculations on our data with the visualization capabilities of Seaborn, we can gain insights from our data and effectively communicate our findings through visualizations.
Here's a detailed explanation of how to use Seaborn in combination with pandas to perform calculations on data.
Import the necessary libraries
At first import all the required libraries such as seaborn and pandas in the python environment.
import seaborn as sns
import pandas as pd
Load your data into a pandas DataFrame
Next we have to load the dataset using the read_csv() function in pandas library.
df = pd.read_csv("https://gist.githubusercontent.com/netj/8836201/raw/6f9306ad21398ea43cba4f7d537619d0e07d5ae3/iris.csv")
Perform calculations using pandas
Pandas provides various methods and functions to perform calculations on data. Here are some examples of common calculations we can perform using pandas
Calculate the mean of a column
To calculate the mean of a particular column we have mean() function in pandas library.
Example
mean_value = df['petal.width'].mean()
print("The mean of the petal.width column:",mean_value)
Output
The mean of the petal.width column: 1.199333333333334
Calculate the standard deviation of a column
For calculating the standard deviation of a column we have the function called std() function in pandas library.
Example
std_value = df['petal.width'].std()
print("The standard deviation of the petal.width column:",std_value)
Output
The standard deviation of the petal.width column: 0.7622376689603465
Calculate the sum of a column
We have the function in pandas called sum() which is used to calculate the sum of the column.
sum_value = df['petal.width'].sum()
print("The sum of the petal.width column:",sum_value)
The above are just a few examples that pandas provides a wide range of methods for performing calculations, including aggregations, statistical functions, and more.
Visualize the calculated results using Seaborn
Once we have performed calculations on our data using pandas, we can use Seaborn to visualize the calculated results. Seaborn provides a wide range of plotting functions that accept pandas Series or DataFrame objects as input.
We can use various other Seaborn plotting functions to visualize our calculated results, such as box plots, violin plots, point plots, and more. Seaborn provides numerous customization options to enhance the visual representation of our data.
Example
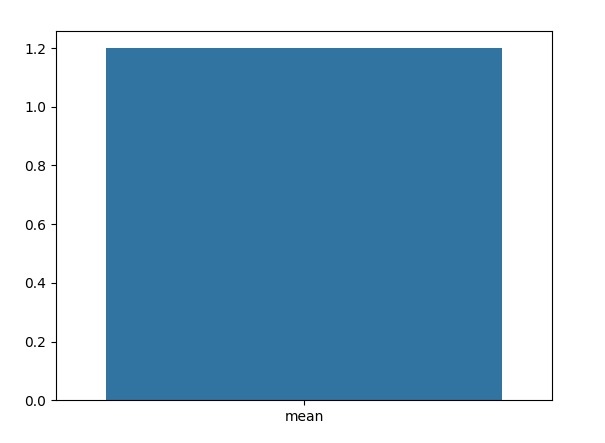
In this example, we use the 'barplot()' function from Seaborn to create a bar plot of the mean value. The 'x' parameter represents the x-axis labels and the 'y' parameter represents, the calculated mean value.
#Create a bar plot of the mean values
sns.barplot(x=['mean'], y=[mean_value])
Output

Note
While Seaborn itself does not provide direct calculation methods, it leverages the power of pandas for data manipulation and calculations. Therefore, it's important to have a good understanding of pandas and its functionalities to perform advanced calculations on our data before visualizing it using Seaborn.

