- React - Home
- React - Introduction
- React - Roadmap
- React - Installation
- React - Features
- React - Advantages & Disadvantages
- React - Architecture
- React - Creating a React Application
- React - JSX
- React - Components
- React - Nested Components
- React - Using Newly Created Components
- React - Component Collection
- React - Styling
- React - Properties (props)
- React - Creating Components using Properties
- React - props Validation
- React - Constructor
- React - Component Life Cycle
- React - Event management
- React - Creating an Event−Aware Component
- React - Introduce Events in Expense Manager APP
- React - State Management
- React - State Management API
- React - Stateless Component
- React - State Management Using React Hooks
- React - Component Life Cycle Using React Hooks
- React - Layout Component
- React - Pagination
- React - Material UI
- React - Http Server
- React - Http client programming
- React - Form Programming
- React - Forms
- React - Controlled Component
- React - Uncontrolled Component
- React - Formik
- React - Conditional Rendering
- React - Lists
- React - Keys
- React - Routing
- React - Redux
- React - Animation
- React - Bootstrap
- React - Map
- React - Table
- React - Managing State Using Flux
- React - Testing
- React - CLI Commands
- React - Building and Deployment
- React - Example
- Hooks
- React - Introduction to Hooks
- React - Using useState
- React - Using useEffect
- React - Using useContext
- React - Using useRef
- React - Using useReducer
- React - Using useCallback
- React - Using useMemo
- React - Custom Hooks
- React Advanced
- React - Accessibility
- React - Code Splitting
- React - Context
- React - Error Boundaries
- React - Forwarding Refs
- React - Fragments
- React - Higher Order Components
- React - Integrating With Other Libraries
- React - Optimizing Performance
- React - Profiler API
- React - Portals
- React - React Without ES6 ECMAScript
- React - React Without JSX
- React - Reconciliation
- React - Refs and the DOM
- React - Render Props
- React - Static Type Checking
- React - Strict Mode
- React - Web Components
- Additional Concepts
- React - Date Picker
- React - Helmet
- React - Inline Style
- React - PropTypes
- React - BrowserRouter
- React - DOM
- React - Carousel
- React - Icons
- React - Form Components
- React - Reference API
- React Useful Resources
- React - Quick Guide
- React - Cheatsheet
- React - Axios CheatSheet
- React - Useful Resources
- React - Discussion
React - Error Boundaries
In general, it is quite challenging to catch error and process it without affecting the UI of the application. React introduces a concept called error boundaries to catch a error during UI rendering, process it in the background and show a fallback UI in the front-end application. This will not affect the UI application as it is handled using alternative UI like warning message instead of broken pages.
Let us learn what is error boundary and how to apply it in our application in this chapter.
Concept of error boundary
Error boundaries are normal react component with special features to catch all the errors occurred anywhere in the component tree. The error caught during the process can be logged and then alternative user interface specifying the error can be shown to the user.
A normal react class based component can be upgraded to a component supporting error boundary by implementing two functions.
static getDerivedStateFromError() − This is a static function and will be called when an error occurs in the application.
static getDerivedStateFromError(error) {
   return { hasError: true };
}
Here, hasError is a custom state variable specifying that the application has some error and can be used in subsequent render to show fallback UI instead of normal UI.
componentDidCatch() − This is a component life cycle event called with the error information when an error occurs in the component tree
componentDidCatch(error, errorInfo) {
   // log the error in console or store it somewhere using a log service
}
Once a component is upgraded to handle the error, then it can be use anywhere in the application as normal component. Let us consider the name of the component is SimpleErrorBoundary, then it can be use as shown below −
<SimpleErrorBoundary>
   <MyComponent />
</SimpleErrorBoundary>
Here,
React will catch the error occurs anywhere in the MyComponent component and send it to SimpleErrorBoundary component for further processing.
React will not catch all error except error occurring in below scenarios,
Event handlers − Event handlers are plain javascript function, which can use try/catch and render fallback UI itself and may not need error boundary hint.
Async code like setTimeout.
Server side rendering. Error boundary is exclusively for front-end application.
Error happening in the error boundary component itself.
Applying error boundary
Let us create a new react application to learn how to apply error boundary in this section.
First of all, create a new react application and start it using below command.
create-react-app myapp
cd myapp
npm start
Next, open App.css (src/App.css) and remove all CSS classes.
SimpleErrorBoundary.js
Then, create a simple component, SimpleErrorBoundary (src/Components/SimpleErrorBoundary.js) and render either fallback UI during error or children components as shown below −
import React from "react";
class SimpleErrorBoundary extends React.Component {

   constructor(props) {
      super(props);
      this.state = { hasError: false };
   }
   static getDerivedStateFromError(error) {
      return { hasError: true };
   }

   componentDidCatch(error, errorInfo) {
      console.log(error);
      console.log(errorInfo);
   }

   render() {
      if (this.state.hasError) {
         return <h1>Please contact the administrator.</h1>;
      }
      return this.props.children;
   }
}
export default SimpleErrorBoundary;
Here,
hasError is a state variable initialized with false value.
getDerivedStateFromError updates the error state when there is an error
componentDidCatch logs the error into the console.
render will render either error UI or children based on the error in the application.
Hello.js
Next, create a simple component, Hello (src/Components/Hello.js) and render a simple text message as shown below −
import React from "react";
class Hello extends React.Component {
   constructor(props) {
      super(props)
   }
   render() {
      if(this.props.name == "error") {
         throw('Invoked error')
      }
      return (
         <div>Hello, {this.props.name}</div>
      );
   }
}
export default Hello;
Here we have,
Used name props to show the greeting message.
Throws error if the given name is error.
App.js
Next, open App component (src/App.js), and use SimpleErrorBoundary component as shown below −
import './App.css'
import React from 'react';
import SimpleErrorBoundary from './Components/SimpleErrorBoundary'
import Hello from './Components/Hello'
function App() {
   return (
      <div className="container">
         <div style={{ padding: "10px" }}>
            <div>
               <SimpleErrorBoundary>
                  <Hello name="error" />
               </SimpleErrorBoundary>
            </div>
         </div>
      </div>
   );
}
export default App;
Here we have,
Imported SimpleErrorBoundary component from the react package.
Used SimpleErrorBoundary component with error as value for name props.
Finally, open the application in the browser and check the final result.
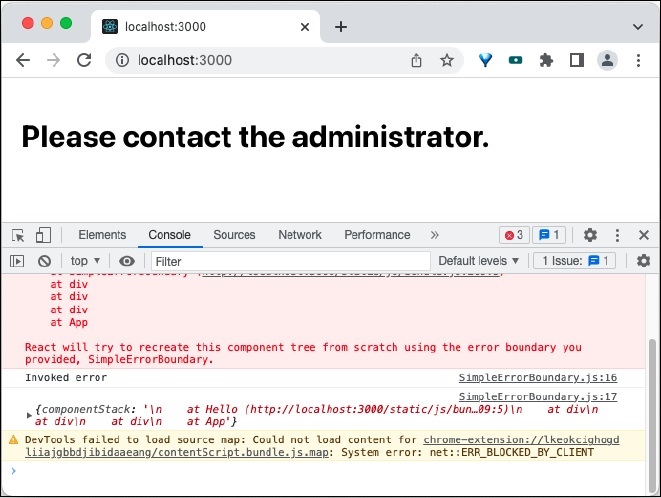
Open the console in the dev tools and you can see the error information as shown below −
Invoked error
SimpleErrorBoundary.js:17 {
   componentStack: '\n at Hello (http://localhost:3000/static/js/bun09:5)\n at
   div\n at div\n at div\n    at App'
}
Summary
Error boundary is safe and valuable component to handle unexpected error in the front end application. Without error boundary, it will be hard to hide the error and get the valuable debugging information about the error happened.
