
Article Categories
- All Categories
-
 Data Structure
-
 Networking
-
 RDBMS
RDBMS
-
 Operating System
-
 Java
Java
-
 MS Excel
-
 iOS
iOS
-
 HTML
HTML
-
 CSS
CSS
-
 Android
-
 Python
-
 C Programming
-
 C++
C++
-
 C#
C#
-
 MongoDB
-
 MySQL
MySQL
-
 Javascript
-
 PHP
PHP
-
 Economics & Finance
Creating an Excel-like data grid in React JS
In this article, we will see how to create an Excel-like data grid in React JS frontend. We will use a third-party package for this, which is called react-data-grid. This is a useful package if you are working with data and want to make a dashboard application.
First create a react project −
npx create-react-app tutorialpurpose
Go to the project directory −
cd tutorialpurpose
Example
Download and install the react-data-grid package −
npm i --save react-data-grid
We can use this package to add default styled grid tables or you can say data grids which are premade.
Add the following lines of code in App.js −
import DataGrid from "react-data-grid";
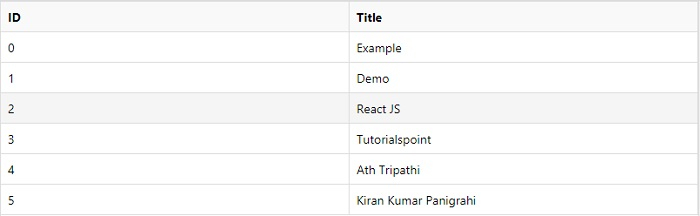
const columns = [
{ key: "id", name: "ID" },
{ key: "title", name: "Title" },
];
const rows = [
{ id: 0, title: "Example" },
{ id: 1, title: "Demo" },
{ id: 2, title: "React JS" },
{ id: 3, title: "Tutorialspoint" },
{ id: 4, title: "Ath Tripathi" },
{ id: 5, title: "Kiran Kumar Panigrahi" },
];
export default function App() {
return <DataGrid columns={columns} rows={rows} />;
}
Explanation
The concept is simple. We first make a column variable to indicate how the columns should be arranged. It will be a list of JSON objects and one column should have two keys: “key” which will be used for reference when creating a row and “name” which will be used for showing the column name.
The row variable will be same as the column variable. Keys of row’s JSON will be the “key” of column variable, and the value will be the data to show under that column.
Output
On execution, it will produce the following output −

1K+ Views
