
Article Categories
- All Categories
-
 Data Structure
-
 Networking
-
 RDBMS
RDBMS
-
 Operating System
-
 Java
Java
-
 MS Excel
-
 iOS
iOS
-
 HTML
HTML
-
 CSS
CSS
-
 Android
-
 Python
-
 C Programming
-
 C++
C++
-
 C#
C#
-
 MongoDB
-
 MySQL
MySQL
-
 Javascript
-
 PHP
PHP
-
 Economics & Finance
Create Cartesian Axes in MATLAB
When a figure is constructed in MATLAB as a graphical component, the cartesian axes are automatically added; however, MATLAB has a function, the 'axes()' function, to carry out the specific task. Cartesian axes are produced in a figure by this function. When several cartesian planes are required in a single figure component, it is quite helpful. In this tutorial, we will explore how to create cartesian axes in MATLAB.
Now, let us discuss different syntaxes of the 'axes' function to create cartesian axes with the help of example programs.
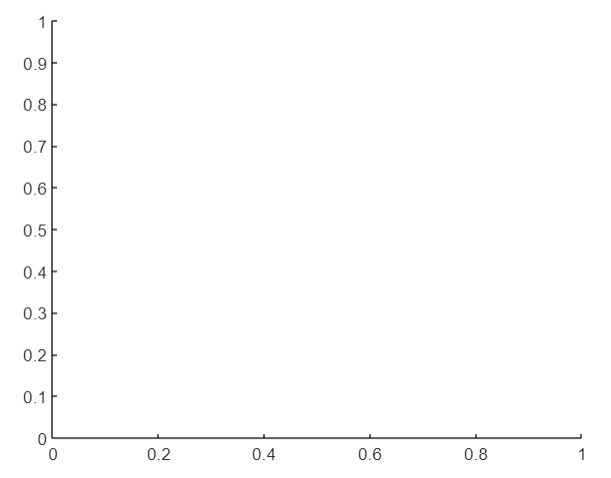
(1). Create Default Cartesian Axes
In MATLAB, we can use the following syntax of the 'axes' function to create a default cartesian axes ?
a = axes;
Consider the following MATLAB program to understand the implementation of this syntax.
Matlab Example (1)
% MATLAB program for creating default cartesian axes
% Create the default cartesian axes
a = axes;
Output
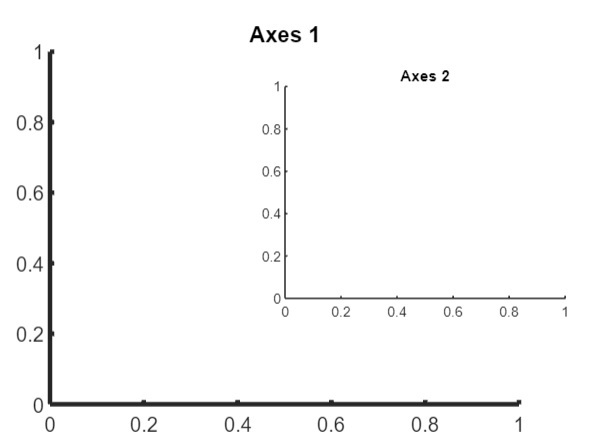
(2). Create Cartesian Axes with Custom Properties
The following syntax of the 'axes' function is used to create a cartesian axes with custom properties.
a = axes(Name, Value);
Here, the Name-Value pair specifies the custom properties of the cartesian axes to change its appearance.
Consider the following MATLAB program to create a cartesian axes with custom properties.
Matlab Example (2)
% MATLAB program for creating cartesian axes with custom properties
% Create the cartesian axes with custom properties
% Example axes 1
A1 = axes('Position', [0.25 0.25 0.5 0.5], 'LineWidth', 3, 'FontSize', 13); title('Axes 1');

% Example axes 2
A2 = axes('Position', [0.5 0.4 0.3 0.3], 'LineWidth', 1, 'FontSize', 9); title('Axes 2');
Output
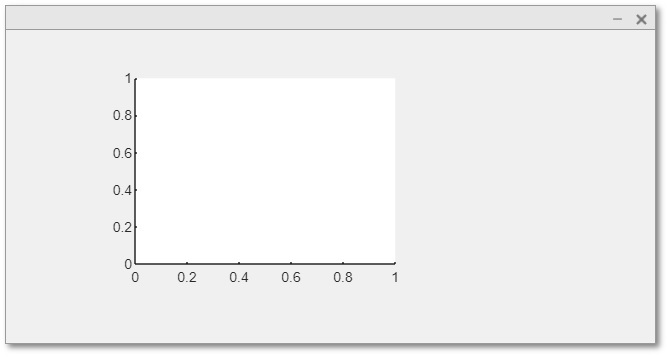
(3). Create Cartesian Axes within a Parent Container
The following syntax of the 'axes' function is used to create a cartesian axes within a specified parent container ?
a = axes(parent, Name, Value);
The following MATLAB program demonstrates the implementation of this syntax.
Matlab Example (3)
% MATLAB code for creating cartesian axes within a UI figure
% Create a UI figure window
fig = uifigure;

% Create cartesian axes within the figure window
a = axes(fig, 'Position', [0.2 0.2 0.4 0.4]);
Output
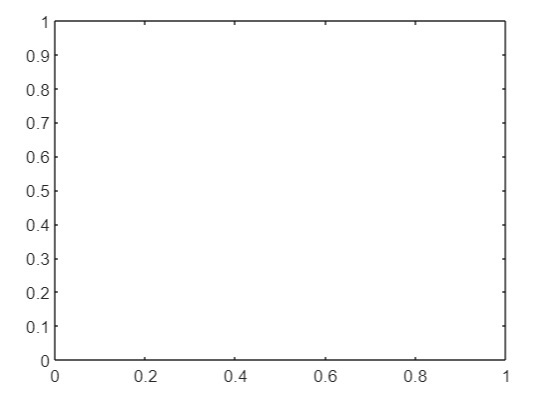
(4). Add Box Around Each Cartesian Axes
Syntax
In MATLAB, the following syntax of the 'axes' function is used to add a box around the cartesian axes ?
a = axes(---, 'Box', 'on');
The following MATLAB program demonstrates the implementation of this syntax.
Matlab Example (4)
% MATLAB program to add boxes around cartesian axis
% Create a cartesian axes with boxes around it
a = axes('Position', [0.2 0.2 0.5 0.5], 'Box', 'on');
Output
Conclusion
In MATLAB, there is a built-in function 'axes' which can have different syntaxes based on different use cases. We have explained and demonstrated different syntaxes of the 'axes' function in the above sections of this article.

258 Views
