
Article Categories
- All Categories
-
 Data Structure
-
 Networking
-
 RDBMS
RDBMS
-
 Operating System
-
 Java
Java
-
 MS Excel
-
 iOS
iOS
-
 HTML
HTML
-
 CSS
CSS
-
 Android
-
 Python
-
 C Programming
-
 C++
C++
-
 C#
C#
-
 MongoDB
-
 MySQL
MySQL
-
 Javascript
-
 PHP
PHP
-
 Economics & Finance
Analyzing Monitor Results in Postman
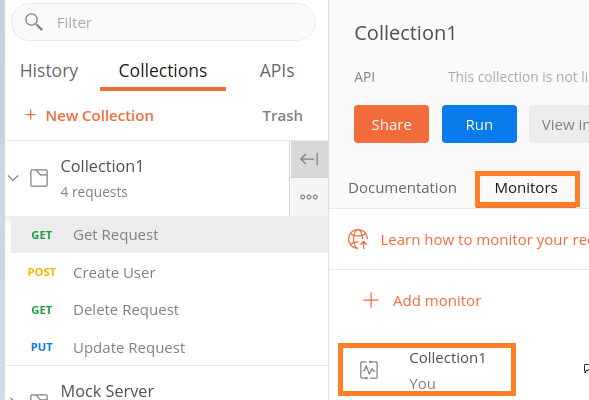
Once a scheduled Collection Monitor gets triggered, we have to analyze the results. Click on the Monitor name available under the Monitors tab.
A new window opens in the browser that shall redirect to the Postman account that we are signed in.
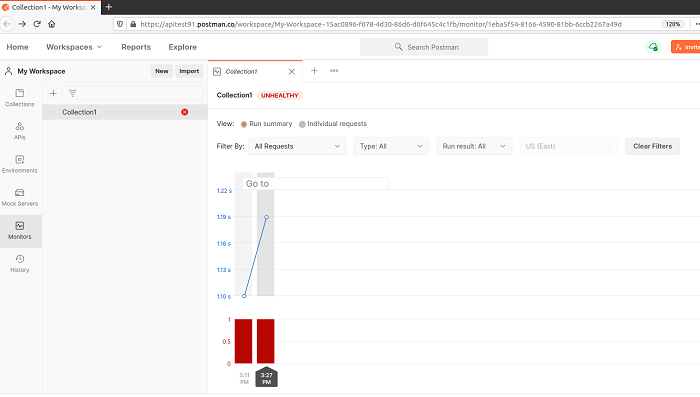
If we analyze the performance graph of the API in the above image, we see the red bars which depict tests have failed for the request. A green bar points to the fact that tests have passed. On hovering on a particular bar, we shall get date, time, Response time and the percentage of test result for a particular run.
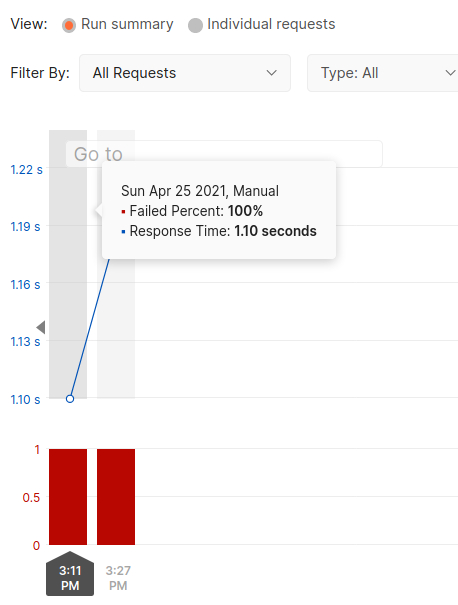
Also, the corresponding data for that execution (Response code, status, time and size) shall display at the bottom of the page.

For debugging errors, we can click on the Console Log tab to get to specific errors.
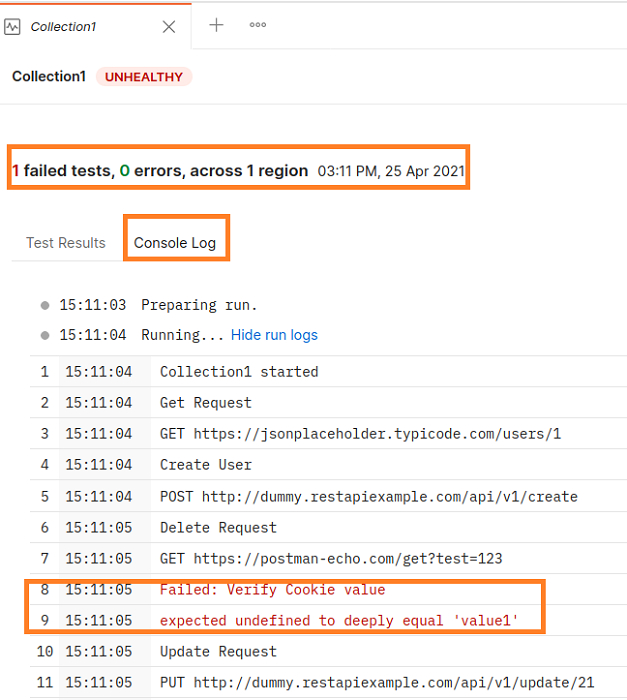
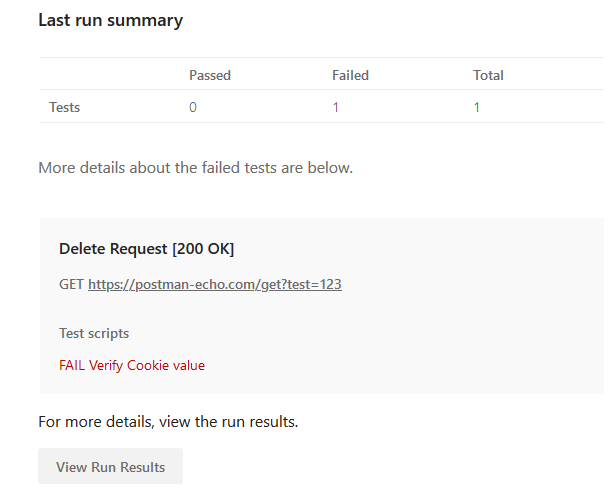
An e-mail also gets triggered for the failed test.

226 Views
