- HTML Canvas Tutorial
- HTML Canvas - Home
- HTML Canvas - Introduction
- Environmental Setup
- HTML Canvas - First Application
- HTML Canvas - Drawing 2D Shapes
- HTML Canvas - Path Elements
- 2D Shapes Using Path Elements
- HTML Canvas - Colors
- HTML Canvas - Adding Styles
- HTML Canvas - Adding Text
- HTML Canvas - Adding Images
- HTML Canvas - Canvas Clock
- HTML Canvas - Transformations
- Composting and Clipping
- HTML Canvas - Basic Animations
- Advanced Animations
- HTML Canvas API Functions
- HTML Canvas - Element
- HTML Canvas - Rectangles
- HTML Canvas - Lines
- HTML Canvas - Paths
- HTML Canvas - Text
- HTML Canvas - Colors and Styles
- HTML Canvas - Images
- HTML Canvas - Shadows and Transformations
- HTML Canvas Useful Resources
- HTML Canvas - Quick Guide
- HTML Canvas - Useful Resources
- HTML Canvas - Discussion
HTML Canvas - Drawing 2D Shapes
Till now we have seen how to draw the Canvas element using attributes. Now we will be building simple 2D shapes and rendering them inside the Canvas element. The Canvas element supports only two primitive shapes, rectangles, and paths by which all the remaining shapes can be drawn easily. There are many drawing functions available which makes it easier to construct all the remaining shapes from paths.
HTML5 Canvas can be used to draw 2D shapes which are used further to develop graphical objects. It is possible to draw all kinds of shapes using Canvas elements including complex shapes such as polygons and curves. Each of the shapes that can be drawn using Canvas is drawn using basic design features such as fill and stroke. These features help us to add graphics to the hollow 2D shapes and make beautiful visualizations. Before drawing shapes on Canvas, we must understand the grid concept to efficiently construct graphical shapes. The Canvas element can be accessed to draw various shapes using the following steps
Find the Canvas element.
Create a Drawing object using JavaScript to draw inside the canvas element.
Draw on the canvas using script objects.
Almost all 2D shapes can be drawn using the Canvas element which is further styled by some common functions and Event listeners such as gradient, colors, etc. These help in increasing user interactivity and visual content understanding.
The shapes that can be drawn using the Canvas element are
Rectangles
Squares (using rectangle functions)
Circles
ellipse
Triangles
Curves
Lines
Arcs
Canvas co-ordinate space (Grid)
To draw any shape using the Canvas element, we must understand the concept of a Grid. The grid shows the structural representation of the Canvas element and helps us to understand how a shape is inserted into the canvas. The whole Canvas element is divided into squares with a side of 1 pixel. The coordinates of the outer Canvas element are considered to draw the elements in the canvas at different positions. The shapes are generally inserted into the Canvas such that their coordinates lie between origin and the canvas width and height. Below is the image of the grid and how a square is inserted into the Canvas element.
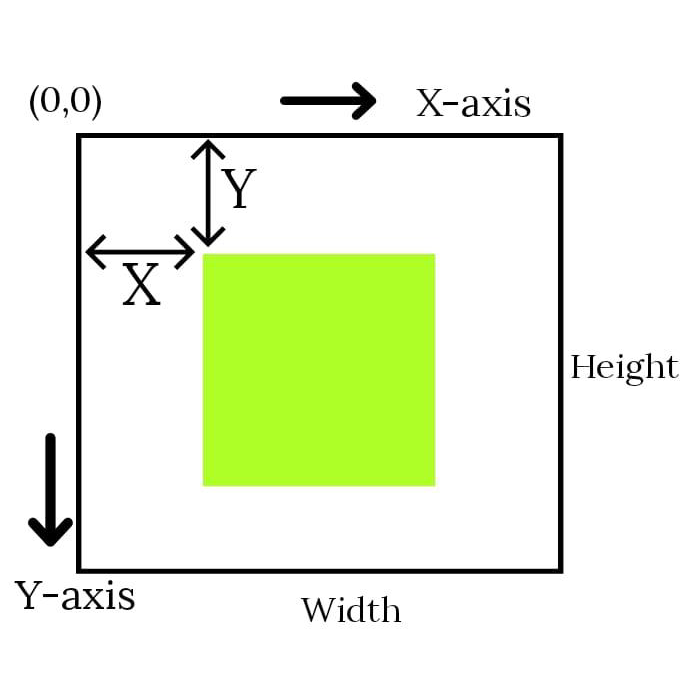
Normally, one unit inside the Canvas is considered as 1 pixel. The origin of this grid is positioned in the top left corner with coordinates (0,0). All elements are placed using this origin and the bottom-left coordinates (canvas width, canvas height). So, the position of the top left corner of the green square inside the Canvas element becomes x pixels from the left and y pixels from the top, at coordinate (x, y).
Drawing rectangles using HTML5 Canvas
Rectangles can be drawn in two ways. The first one is by using four lines (two parallel lines each representing width and height of the rectangle) which makes it complex and not generic. The other approach to drawing rectangles is by using the available functions. Three functions can be used to draw rectangles using Canvas by considering the coordinates of the shape. We can draw rectangles using three functions namely
| S.No | Method & Description |
|---|---|
| 1 | fillRect(x, y, width, height) This function creates a filled rectangle. |
| 2 | strokeRect(x, y, width, height) This function creates a stroked/hollow rectangle. |
| 3 | clearRect(x, y, width, height) This function creates a clear rectangle. |
17 Each of these functions is used to create/draw a different type of rectangle. The parameters involved in the functions are
(X, Y) − Distance from the origin. The main point from which the rectangle is drawn.
Width − The width of the rectangle to be drawn.
Height − The height of the rectangle to be drawn.
Each of the rectangle functions is implemented below with functioning code.
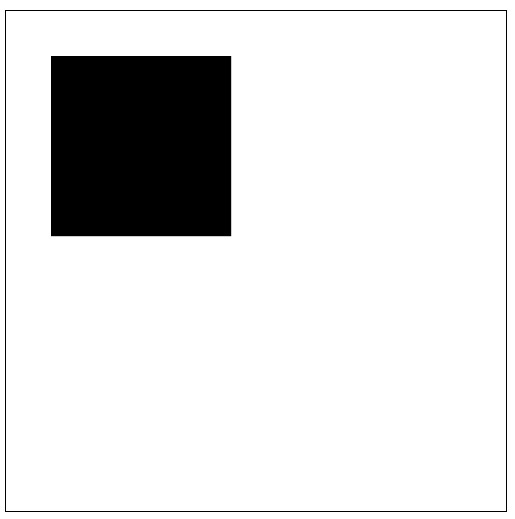
Creating a Fill Rectangle
By using the above function, we can draw a filled rectangle. It takes the starting co-ordinates (x, y) and the width and height of rectangle as parameters. Simple syntax for the function is
Canvas.fillRect(50, 50, 300, 150);
Example
The code to implement fillRect() is given below.
<!DOCTYPE html>
<html lang="en">
   <head>
      <title>fillRect()</title>
      <style>
         body {
            margin: 10px;
            padding: 10px;
         }
      </style>
      <script>
         function rectangle() {
            var canvas = document.getElementById('canvas');
            if (canvas.getContext) {
               var ctx = canvas.getContext('2d');
               ctx.fillRect(50, 50, 200, 200);
            }
         }
      </script>
   </head>
   <body onload="rectangle();">
      <canvas id="canvas" width="555" height="555" style="border: 1px solid black;"></canvas>
   </body>
</html>
Output
The output for the following code is
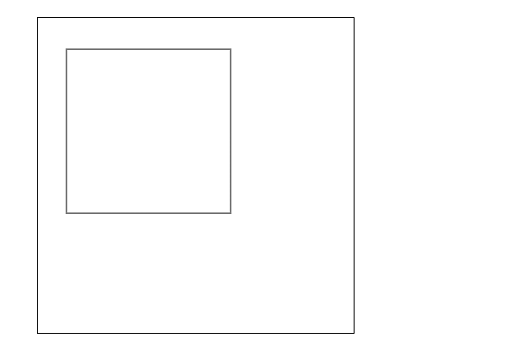
Creating a Stroke Rectangle
A rectangular outline can be drawn using strokeRect() function. It takes the starting co-ordinates (x, y) and the width and height of rectangle as parameters. Simple syntax for the function is
Canvas.strokeRect(50, 50, 300, 300);
Example
Following example creates a stroked rectangle
<!DOCTYPE html>
<html lang="en">
   <head>
      <title>strokeRect()</title>
      <style>
         body {
            margin: 10px;
            padding: 10px;
         }
      </style>
   </head>
   <body onload="rectangle();">
      <canvas id="canvas" width="555" height="555" style="border: 1px solid black;"></canvas>
      <script>
         function rectangle() {
            var canvas = document.getElementById('canvas');
            var context = canvas.getContext('2d');
            var x = 50;
            var y = 50;
            var width = 200;
            var height = 200;
            context.strokeRect(x, y, width, height);
         }
      </script>
   </body>
</html>
Output
The output for the above code is
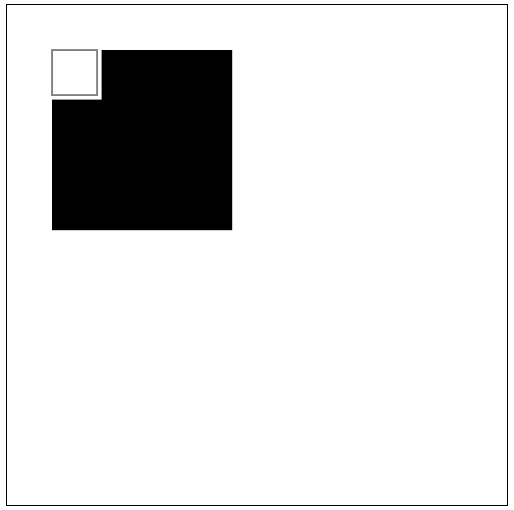
Creating a Clear Rectangle
It takes the starting coordinates (x,y) and the width and height of the rectangle as parameters. The simple syntax for the function is
Canvas.clearRect(50, 50, 60, 60);
The following function clears the specified rectangular area by making it completely transparent. To understand the function, we will be using both the functions fillRect() and strokeRect(). Following example shows how the function clearRect() is worked.
Example
<!DOCTYPE html>
<html lang="en">
   <head>
      <title>clearRect()</title>
      <style>
         body {
            margin: 10px;
            padding: 10px;
         }
      </style>
      <script>
         function rectangle() {
            var canvas = document.getElementById('canvas');
            if (canvas.getContext) {
               var ctx = canvas.getContext('2d');
               ctx.fillRect(50, 50, 200, 200);
               ctx.clearRect(45, 45, 60, 60);
               ctx.strokeRect(50, 50, 50, 50);
            }
         }
      </script>
   </head>
   <body onload="rectangle();">
      <canvas id="canvas" width="555" height="555" style="border: 1px solid black;"></canvas>
   </body>
</html>
Output
The output is shown below, the fillRect() fills the whole rectangle with black color in the given dimensions. The strokeRect() function marks the margin with the given dimensions and the clearRect() makes the rectangle area transparent by removing the black color.
To Continue Learning Please Login