- GWT Highcharts Tutorial
- GWT Highcharts - Home
- GWT Highcharts - Overview
- Environment Setup
- Configuration Syntax
- GWT Highcharts - Line Charts
- GWT Highcharts - Area Charts
- GWT Highcharts - Bar Charts
- GWT Highcharts - Column Charts
- GWT Highcharts - Pie Charts
- GWT Highcharts - Scatter Chart
- GWT Highcharts - Dynamic Charts
- GWT Highcharts - Combinations
- GWT Highcharts - 3D Charts
- GWT Highcharts - Map Charts
- GWT Highcharts Useful Resources
- GWT Highcharts - Quick Guide
- GWT Highcharts - Useful Resources
- GWT Highcharts - Discussion
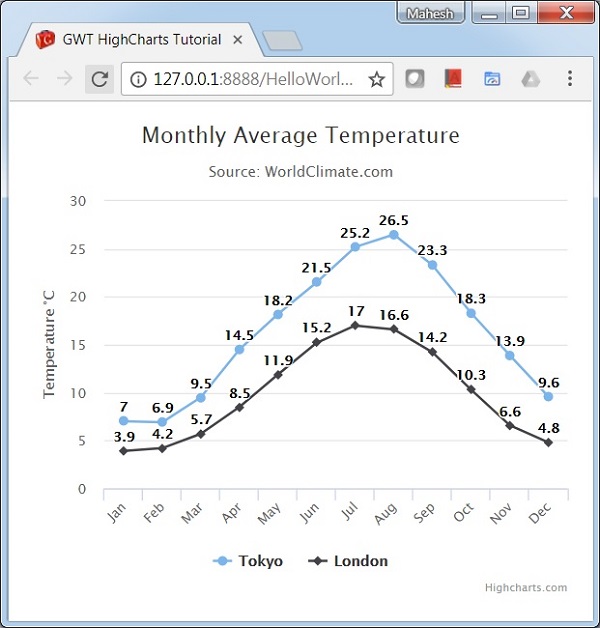
Line Chart with Data Labels
We have already seen the configuration used to draw this chart in Highcharts Configuration Syntax chapter. Let us now consider the following example to further understand a basic line chart with data labels.
Example
HelloWorld.java
package com.tutorialspoint.client;

import org.moxieapps.gwt.highcharts.client.Chart;
import org.moxieapps.gwt.highcharts.client.Series.Type;
import org.moxieapps.gwt.highcharts.client.ToolTip;
import org.moxieapps.gwt.highcharts.client.XAxis;
import org.moxieapps.gwt.highcharts.client.YAxis;
import org.moxieapps.gwt.highcharts.client.labels.DataLabels;
import org.moxieapps.gwt.highcharts.client.plotOptions.LinePlotOptions;

import com.google.gwt.core.client.EntryPoint;
import com.google.gwt.user.client.ui.RootPanel;

public class HelloWorld implements EntryPoint {
   public void onModuleLoad() {
      Chart chart = new Chart()
         .setType(Type.LINE)
         .setChartTitleText("Monthly Average Temperature")
         .setChartSubtitleText("Source: WorldClimate.com");

      XAxis xAxis = chart.getXAxis();
      xAxis.setCategories("Jan", "Feb", "Mar", "Apr", "May", "Jun",
         "Jul", "Aug", "Sep", "Oct", "Nov", "Dec");

      YAxis yAxis = chart.getYAxis();
      yAxis.setAxisTitleText("Temperature °C");
      yAxis.createPlotLine()
         .setValue(0)
         .setWidth(1)
         .setColor("#808080");

      ToolTip toolTip = new ToolTip();
      toolTip.setValueSuffix("°C");
      chart.setToolTip(toolTip);

      chart.setLinePlotOptions(new LinePlotOptions()
         .setEnableMouseTracking(true)
         .setDataLabels(new DataLabels()
            .setEnabled(true)
         )
      );

      chart.addSeries(chart.createSeries()
         .setName("Tokyo")
         .setPoints(new Number[] {
            7.0, 6.9, 9.5, 14.5, 18.2, 21.5, 25.2,
            26.5, 23.3, 18.3, 13.9, 9.6
         })
      );

      chart.addSeries(chart.createSeries()
         .setName("London")
         .setPoints(new Number[] {
            3.9, 4.2, 5.7, 8.5, 11.9, 15.2, 17.0,
            16.6, 14.2, 10.3, 6.6, 4.8
         })
      );
      RootPanel.get().add(chart);
   }
}
Result
Verify the result.
gwt_highcharts_line_charts.htm
Advertisements