- GWT Highcharts Tutorial
- GWT Highcharts - Home
- GWT Highcharts - Overview
- Environment Setup
- Configuration Syntax
- GWT Highcharts - Line Charts
- GWT Highcharts - Area Charts
- GWT Highcharts - Bar Charts
- GWT Highcharts - Column Charts
- GWT Highcharts - Pie Charts
- GWT Highcharts - Scatter Chart
- GWT Highcharts - Dynamic Charts
- GWT Highcharts - Combinations
- GWT Highcharts - 3D Charts
- GWT Highcharts - Map Charts
- GWT Highcharts Useful Resources
- GWT Highcharts - Quick Guide
- GWT Highcharts - Useful Resources
- GWT Highcharts - Discussion
GWT Highcharts - Quick Guide
GWT Highcharts - Overview
GWT Highcharts is a open source java based library to provides an elegant and feature rich Highcharts visualizations within a GWT application and can be used along with GWT widget libraries.
Features
Compatible - All modern browsers are supported along with iPhone/iPad browsers and Internet Explorer 6 onwards. Modern browsers use SVG for the graphics rendering and in legacy Internet Explorer graphics are drawn using VML.
Pure Java - No JavaScript is required as complete Highcharts API is available in Java methods.
No Flash - No requirement of client side plug-ins like Flash player or Java as Highcharts is uses native browser technologies and charts can run without modification on modern mobile devices.
Clean Syntax - Most of the methods are chainable thus configuration options of the chart can be managed using syntax as tight as JSON.
Dynamic - Series and points can be added dynamically any time after chart creation. Event hooks supported. Server interactions are supported.
Documented - Highcharts APIs are thoroughly documented with numerous code and syntax examples.
GWT Highcharts - Environment Setup
This tutorial will guide you on how to prepare a development environment to start your work with Highcharts and GWT Framework. This tutorial will also teach you how to setup JDK, Tomcat and Eclipse on your machine before you setup GWT Framework −
System Requirement
GWT requires JDK 1.6 or higher so the very first requirement is to have JDK installed in your machine.
| JDK | 1.6 or above. |
|---|---|
| Memory | no minimum requirement. |
| Disk Space | no minimum requirement. |
| Operating System | no minimum requirement. |
Follow the given steps to setup your environment to start with GWT application development.
Step 1 - Verify Java Installation on your Machine
Now open console and execute the following java command.
| OS | Task | Command |
|---|---|---|
| Windows | Open Command Console | c:\> java -version |
| Linux | Open Command Terminal | $ java -version |
| Mac | Open Terminal | machine:~ joseph$ java -version |
Let's verify the output for all the operating systems
| Sr.No. | OS & Generated Output |
|---|---|
| 1 |
Windows java version "1.6.0_21" Java(TM) SE Runtime Environment (build 1.6.0_21-b07) Java HotSpot(TM) Client VM (build 17.0-b17, mixed mode, sharing) |
| 2 |
Linux java version "1.6.0_21" Java(TM) SE Runtime Environment (build 1.6.0_21-b07) ava HotSpot(TM) Client VM (build 17.0-b17, mixed mode, sharing) |
| 3 |
Mac java version "1.6.0_21" Java(TM) SE Runtime Environment (build 1.6.0_21-b07) Java HotSpot(TM)64-Bit Server VM (build 17.0-b17, mixed mode, sharing) |
Step 2 - Setup Java Development Kit (JDK)
If you do not have Java installed then you can install the Java Software Development Kit (SDK) from Oracle's Java site: Java SE Downloads. You will find instructions for installing JDK in downloaded files, follow the given instructions to install and configure the setup. Finally set PATH and JAVA_HOME environment variables to refer to the directory that contains java and javac, typically java_install_dir/bin and java_install_dir respectively.
Set the JAVA_HOME environment variable to point to the base directory location where Java is installed on your machine. For example
| Sr.No. | OS & Output |
|---|---|
| 1 |
Windows Set the environment variable JAVA_HOME to C:\Program Files\Java\jdk1.6.0_21 |
| 2 |
Linux export JAVA_HOME = /usr/local/java-current |
| 3 |
Mac export JAVA_HOME = /Library/Java/Home |
Append Java compiler location to System Path.
| Sr.No. | OS & Output |
|---|---|
| 1 |
Windows Append the string ;%JAVA_HOME%\bin to the end of the system variable, Path. |
| 2 |
Linux export PATH=$PATH:$JAVA_HOME/bin/ |
| 3 |
Mac not required |
Alternatively, if you use an Integrated Development Environment (IDE) like Borland JBuilder, Eclipse, IntelliJ IDEA, or Sun ONE Studio, compile and run a simple program to confirm that the IDE knows where you installed Java, otherwise do proper setup as given document of the IDE.
Step 3 - Setup Eclipse IDE
All the examples in this tutorial have been written using Eclipse IDE. So I would suggest you should have latest version of Eclipse installed on your machine based on your operating system.
To install Eclipse IDE, download the latest Eclipse binaries from https://www.eclipse.org/downloads/. Once you downloaded the installation, unpack the binary distribution into a convenient location. For example in C:\eclipse on windows, or /usr/local/eclipse on Linux/Unix and finally set PATH variable appropriately.
Eclipse can be started by executing the following commands on windows machine, or you can simply double click on eclipse.exe
%C:\eclipse\eclipse.exe
Eclipse can be started by executing the following commands on Unix (Solaris, Linux, etc.) machine −
$/usr/local/eclipse/eclipse
After a successful startup, if everything is fine then it should display following result −
Step 4: Install GWT SDK & Plugin for Eclipse
Follow the instructions given at the link Plugin for Eclipse (incl. SDKs) to install GWT SDK & Plugin for Eclipse version installed on your machine.
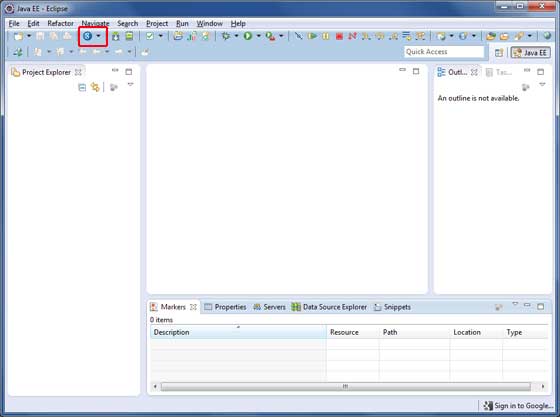
After a successful setup for the GWT plugin, if everything is fine then it should display following screen with Google icon marked with red rectangle as shown below −
Step 5: Install Highcharts
Download the latest Highcharts jar from its Downloadpage and add it to project's classpath.
Add the following entry in <project-name>.gwt.xml file
<inherits name="org.moxieapps.gwt.highcharts.Highcharts"/>
Add the following entry in <project-name>.html file
<script src = "https://ajax.googleapis.com/ajax/libs/jquery/2.1.3/jquery.min.js"/>
<script src = "https://code.highcharts.com/highcharts.js"/>
<script type="text/javascript" src="https://code.highcharts.com/highcharts-3d.js" />
<script type="text/javascript" src="https://code.highcharts.com/highcharts-more.js" />
<script src = "https://code.highcharts.com/modules/heatmap.js" />
<script src = "https://code.highcharts.com/modules/treemap.js" />
GWT Highcharts - Configuration Syntax
In this chapter, we will showcase the configuration required to draw a chart using the Highcharts API in GWT.
Step 1: Create GWT Application
Follow the following steps to update the GWT application we created in GWT - Create Application chapter −
| Step | Description |
|---|---|
| 1 | Create a project with a name HelloWorld under a package com.tutorialspoint as explained in the GWT - Create Application chapter. |
| 2 | Modify HelloWorld.gwt.xml, HelloWorld.html and HelloWorld.java as explained below. Keep rest of the files unchanged. |
| 3 | Compile and run the application to verify the result of the implemented logic. |
Following is the content of the modified module descriptor src/com.tutorialspoint/HelloWorld.gwt.xml.
<?xml version = "1.0" encoding = "UTF-8"?>
<module rename-to = 'helloworld'>
   <inherits name = 'com.google.gwt.user.User'/>
   <inherits name = 'com.google.gwt.user.theme.clean.Clean'/>
   <entry-point class = 'com.tutorialspoint.client.HelloWorld'/>
   <inherits name="org.moxieapps.gwt.highcharts.Highcharts"/>
   <source path = 'client'/>
   <source path = 'shared'/>
</module>
Following is the content of the modified HTML host file war/HelloWorld.html.
<html>
   <head>
      <title>GWT Highcharts Showcase</title>
      <link rel = "stylesheet" href = "HelloWorld.css"/>
      <script language = "javascript" src = "helloworld/helloworld.nocache.js">
         <script src = "https://ajax.googleapis.com/ajax/libs/jquery/2.1.3/jquery.min.js" />
         <script src = "https://code.highcharts.com/highcharts.js" />
      </script>
   </head>
   <body>
   </body>
</html>
We'll see the updated HelloWorld.java in the end after understanding configurations.
Step 2: Create Configurations
Create Chart
Configure the type, title and sub-title of the chart.
Chart chart = new Chart()
.setType(Type.SPLINE)
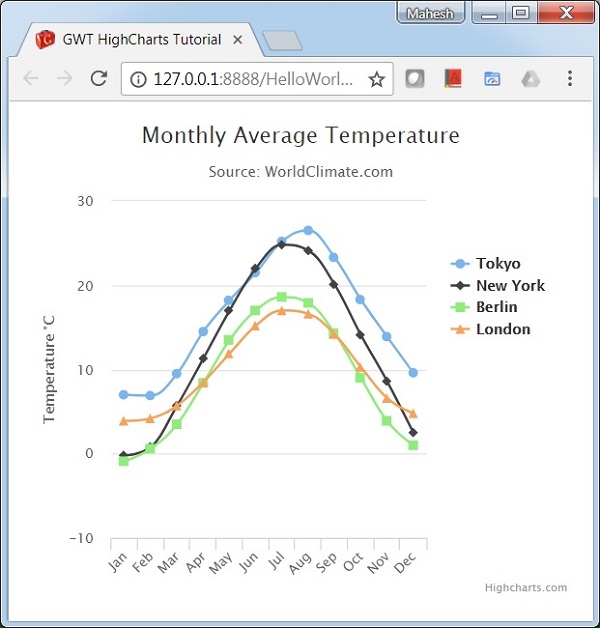
.setChartTitleText("Monthly Average Temperature")
.setChartSubtitleText("Source: WorldClimate.com");
xAxis
Configure the ticker to be displayed on the X-Axis.
XAxis xAxis = chart.getXAxis();
xAxis.setCategories("Jan", "Feb", "Mar", "Apr", "May", "Jun",
   "Jul", "Aug", "Sep", "Oct", "Nov", "Dec");
yAxis
Configure the title, plot lines to be displayed on the Y-Axis.
YAxis yAxis = chart.getYAxis();
yAxis.setAxisTitleText("Temperature °C");
yAxis.createPlotLine()
   .setValue(0)
   .setWidth(1)
   .setColor("#808080");
tooltip
Configure the tooltip. Put suffix to be added after value (y-axis).
ToolTip toolTip = new ToolTip();
toolTip.setValueSuffix("°C");
chart.setToolTip(toolTip);
legend
Configure the legend to be displayed on the right side of the chart along with other properties.
legend.setLayout(Legend.Layout.VERTICAL)
   .setAlign(Legend.Align.RIGHT)
   .setVerticalAlign(Legend.VerticalAlign.TOP)
   .setX(-10)
   .setY(100)
   .setBorderWidth(0);
chart.setLegend(legend);
series
Configure the data to be displayed on the chart. Series is an array where each element of this array represents a single line on the chart.
chart.addSeries(chart.createSeries()
   .setName("Tokyo")
   .setPoints(new Number[] {
      7.0, 6.9, 9.5, 14.5, 18.2, 21.5, 25.2,
      26.5, 23.3, 18.3, 13.9, 9.6
   })
);

chart.addSeries(chart.createSeries()
   .setName("New York")
   .setPoints(new Number[] {
      -0.2, 0.8, 5.7, 11.3, 17.0, 22.0, 24.8,
      24.1, 20.1, 14.1, 8.6, 2.5
   })
);

chart.addSeries(chart.createSeries()
   .setName("Berlin")
   .setPoints(new Number[] {
      -0.9, 0.6, 3.5, 8.4, 13.5, 17.0, 18.6,
      17.9, 14.3, 9.0, 3.9, 1.0
   })
);

chart.addSeries(chart.createSeries()
   .setName("London")
   .setPoints(new Number[] {
      3.9, 4.2, 5.7, 8.5, 11.9, 15.2, 17.0,
      16.6, 14.2, 10.3, 6.6, 4.8
   })
);
Step 3: Add the chart to parent panel.
We're adding the chart to root panel.
RootPanel.get().add(chart);
Example
Consider the following example to further understand the Configuration Syntax −
HelloWorld.java
package com.tutorialspoint.client;

import org.moxieapps.gwt.highcharts.client.Chart;
import org.moxieapps.gwt.highcharts.client.Legend;
import org.moxieapps.gwt.highcharts.client.Series.Type;
import org.moxieapps.gwt.highcharts.client.ToolTip;
import org.moxieapps.gwt.highcharts.client.XAxis;
import org.moxieapps.gwt.highcharts.client.YAxis;

import com.google.gwt.core.client.EntryPoint;
import com.google.gwt.user.client.ui.RootPanel;

public class HelloWorld implements EntryPoint {
   public void onModuleLoad() {
      Chart chart = new Chart()
         .setType(Type.SPLINE)
         .setChartTitleText("Monthly Average Temperature")
         .setChartSubtitleText("Source: WorldClimate.com");

      XAxis xAxis = chart.getXAxis();
      xAxis.setCategories("Jan", "Feb", "Mar", "Apr", "May", "Jun",
         "Jul", "Aug", "Sep", "Oct", "Nov", "Dec");

      YAxis yAxis = chart.getYAxis();
      yAxis.setAxisTitleText("Temperature °C");
      yAxis.createPlotLine()
         .setValue(0)
         .setWidth(1)
         .setColor("#808080");

      ToolTip toolTip = new ToolTip();
      toolTip.setValueSuffix("°C");
      chart.setToolTip(toolTip);

      Legend legend = new Legend();
      legend.setLayout(Legend.Layout.VERTICAL)
         .setAlign(Legend.Align.RIGHT)
         .setVerticalAlign(Legend.VerticalAlign.TOP)
         .setX(-10)
         .setY(100)
         .setBorderWidth(0);
      chart.setLegend(legend);

      chart.addSeries(chart.createSeries()
         .setName("Tokyo")
         .setPoints(new Number[] {
            7.0, 6.9, 9.5, 14.5, 18.2, 21.5, 25.2,
            26.5, 23.3, 18.3, 13.9, 9.6
         })
      );

      chart.addSeries(chart.createSeries()
         .setName("New York")
         .setPoints(new Number[] {
            -0.2, 0.8, 5.7, 11.3, 17.0, 22.0, 24.8,
            24.1, 20.1, 14.1, 8.6, 2.5
         })
      );

      chart.addSeries(chart.createSeries()
         .setName("Berlin")
         .setPoints(new Number[] {
            -0.9, 0.6, 3.5, 8.4, 13.5, 17.0, 18.6,
            17.9, 14.3, 9.0, 3.9, 1.0
         })
      );

      chart.addSeries(chart.createSeries()
         .setName("London")
         .setPoints(new Number[] {
            3.9, 4.2, 5.7, 8.5, 11.9, 15.2, 17.0,
            16.6, 14.2, 10.3, 6.6, 4.8
         })
      );
      RootPanel.get().add(chart);
   }
}
Result
Verify the result.
GWT Highcharts - Line Charts
Line charts are used to draw line/spline based charts. In this section, we will discuss the different types of line and spline based charts.
| Sr.No. | Chart Type & Description |
|---|---|
| 1 | Basic line
Basic line chart. |
| 2 | With data labels
Chart with data labels. |
| 3 | Time series, zoomable
Chart with time series. |
| 4 | Spline with inverted axes
Spline chart having inverted axes. |
| 5 | Spline with symbols
Spline chart using symbols for heat/rain. |
| 6 | Spline with plot bands
Spline chart with plot bands. |
GWT Highcharts - Area Charts
Area charts are used to draw area based charts. In this section, we will discuss the different types of area based charts.
| Sr.No. | Chart Type & Description |
|---|---|
| 1 | Basic Area
Basic area chart. |
| 2 | Area with negative values
Area chart having negative values. |
| 3 | Stacked area
Chart having areas stacked over one another. |
| 4 | Percentage area
Chart with data in percentage terms. |
| 5 | Area with missing points
Chart with missing points in the data. |
| 6 | Inverted axes
Area using inverted axes. |
| 7 | Area-spline
Area chart using spline. |
GWT Highcharts - Bar Charts
Bar charts are used to draw bar based charts. In this section, we will discuss the different types of bar based charts.
| Sr.No. | Chart Type & Description |
|---|---|
| 1 | Basic Bar
Basic bar chart. |
| 2 | Stacked Bar
Bar chart having bar stacked over one another. |
| 3 | Bar Chart with negative values
Bar Chart with negative values. |
GWT Highcharts - Column Charts
Column charts are used to draw column based charts. In this section, we will discuss the different types of column based charts.
| Sr.No. | Chart Type & Description |
|---|---|
| 1 | Basic Column
Basic column chart. |
| 2 | Column with negative values
Column chart having negative values. |
| 3 | Stacked column
Chart having column stacked over one another. |
| 4 | Stacked and Grouped column
Chart with column in stacked and grouped form. |
| 5 | Column with stacked percentage
Chart with stacked percentage. |
| 6 | Column with rotated labels
Column Chart with rotated labels in columns. |
| 7 | Column Range
Column Chart using ranges. |
GWT Highcharts - Pie Charts
Pie charts are used to draw pie based charts. In this section, we will discuss the different types of pie based charts.
| Sr.No. | Chart Type & Description |
|---|---|
| 1 | Basic Pie
Basic pie chart. |
| 2 | Pie with Legends
Pie chart with Legends. |
| 3 | Donut Chart
Donut Chart. |
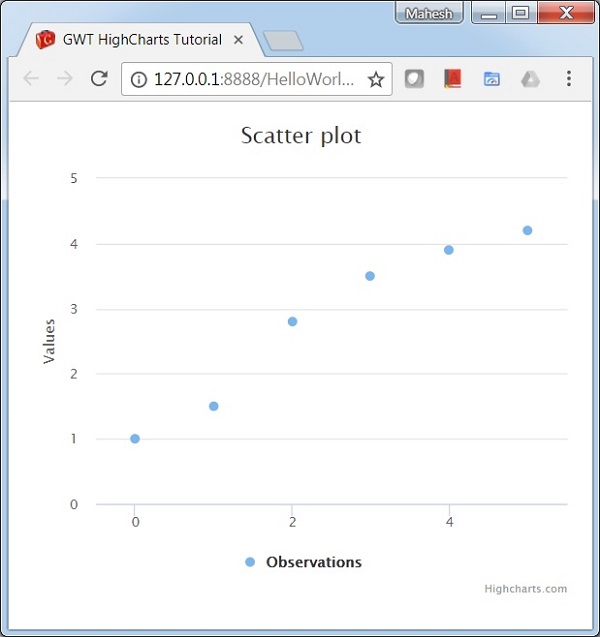
GWT Highcharts - Scatter Chart
Following is an example of a basic scatter chart.
We have already seen the configuration used to draw a chart in Highcharts Configuration Syntax chapter.
An example of a basic scatter chart is given below.
Configurations
Let us now see the additional configurations/steps taken.
series
Configure the chart type to be scatter based. series.type decides the series type for the chart. Here, the default value is "line".
chart.addSeries(chart.createSeries()
   .setName("Observations")
   .setType(Type.SCATTER)
   .setPoints(new Number[] {
      1, 1.5, 2.8, 3.5, 3.9, 4.2
   })
);
Example
HelloWorld.java
package com.tutorialspoint.client;

import org.moxieapps.gwt.highcharts.client.Chart;
import org.moxieapps.gwt.highcharts.client.Series.Type;

import com.google.gwt.core.client.EntryPoint;
import com.google.gwt.user.client.ui.RootPanel;

public class HelloWorld implements EntryPoint {
   public void onModuleLoad() {
      final Chart chart = new Chart()
         .setChartTitleText("Scatter plot");

      chart.getXAxis()
         .setMin(-0.5)
         .setMax(5.5);

      chart.getYAxis()
         .setMin(0);

      chart.addSeries(chart.createSeries()
         .setName("Observations")
         .setType(Type.SCATTER)
         .setPoints(new Number[] {
            1, 1.5, 2.8, 3.5, 3.9, 4.2
         })
      );
      RootPanel.get().add(chart);
   }
}
Result
Verify the result.
GWT Highcharts - Dynamic Charts
Dynamic charts are used to draw data based charts where data can change after rendering of chart. In this section, we will discuss the different types of dynamic chart.
| Sr.No. | Chart Type & Description |
|---|---|
| 1 | Spline updating each second
Spline Chart updating each second. |
| 2 | Click to add a point
Chart with point addition capability. |
GWT Highcharts - Combination Charts
Combination charts are used to draw mixed charts; for example, bar chart with pie chart. In this section, we will discuss the different types of combinations charts.
| Sr.No. | Chart Type & Description |
|---|---|
| 1 | Column, Line and Pie
Chart with Column, Line and Pie. |
| 2 | Dual Axes, Line and Column
Chart with Dual Axes, Line and Column. |
| 3 | Multiple Axes
Chart having Multiple Axes. |
| 4 | Scatter with regression line
Scatter chart with regression line. |
GWT Highcharts - 3D Charts
3D charts are used to draw 3-dimensional charts. In this section, we will discuss the different types of 3D charts.
| Sr.No. | Chart Type & Description |
|---|---|
| 1 | 3D Column
3D Column Chart. |
| 2 | 3D Scatter
3D Scatter Chart. |
| 3 | 3D Pie
3D Pie Chart. |
GWT Highcharts - Map Charts
Map charts are used to draw heat map or Tree map charts. In this section, we will discuss the different types of Map charts.