- GWT Highcharts Tutorial
- GWT Highcharts - Home
- GWT Highcharts - Overview
- Environment Setup
- Configuration Syntax
- GWT Highcharts - Line Charts
- GWT Highcharts - Area Charts
- GWT Highcharts - Bar Charts
- GWT Highcharts - Column Charts
- GWT Highcharts - Pie Charts
- GWT Highcharts - Scatter Chart
- GWT Highcharts - Dynamic Charts
- GWT Highcharts - Combinations
- GWT Highcharts - 3D Charts
- GWT Highcharts - Map Charts
- GWT Highcharts Useful Resources
- GWT Highcharts - Quick Guide
- GWT Highcharts - Useful Resources
- GWT Highcharts - Discussion
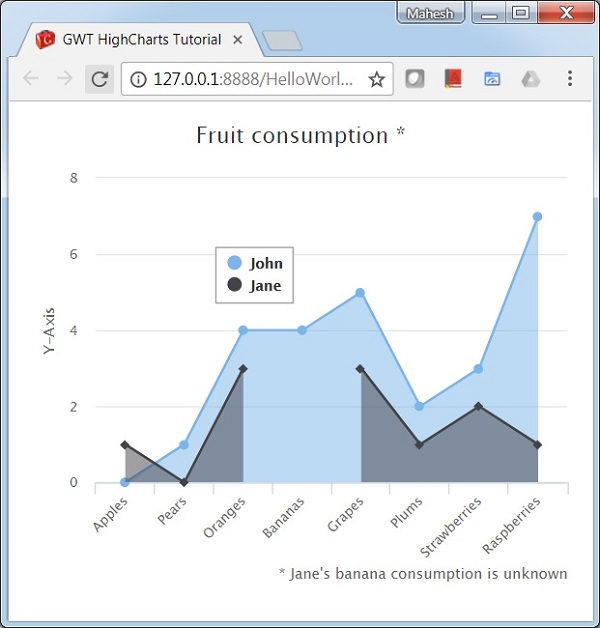
Area Chart with missing values
Following is an example of an area chart with missing values.
We have already seen the configurations used to draw a chart in Highcharts Configuration Syntax chapter. Now, let us see an example of a Area Chart with missing values. We have added spacingBottom attribute in chart.
charts
Configure the spacingBottom of the chart as 30. It signifies the space between the bottom edge of the chart and the content (plot area, axis title and labels, title, subtitle or legend in top position).
chart.setSpacingBottom(30);
Example
HelloWorld.java
package com.tutorialspoint.client;

import org.moxieapps.gwt.highcharts.client.Chart;
import org.moxieapps.gwt.highcharts.client.ChartSubtitle;
import org.moxieapps.gwt.highcharts.client.ChartTitle.Align;
import org.moxieapps.gwt.highcharts.client.ChartTitle.VerticalAlign;
import org.moxieapps.gwt.highcharts.client.Credits;
import org.moxieapps.gwt.highcharts.client.Legend;
import org.moxieapps.gwt.highcharts.client.Series.Type;

import org.moxieapps.gwt.highcharts.client.ToolTip;
import org.moxieapps.gwt.highcharts.client.ToolTipData;
import org.moxieapps.gwt.highcharts.client.ToolTipFormatter;

import org.moxieapps.gwt.highcharts.client.XAxis;
import org.moxieapps.gwt.highcharts.client.YAxis;

import org.moxieapps.gwt.highcharts.client.labels.AxisLabelsData;
import org.moxieapps.gwt.highcharts.client.labels.AxisLabelsFormatter;
import org.moxieapps.gwt.highcharts.client.labels.YAxisLabels;

import org.moxieapps.gwt.highcharts.client.plotOptions.AreaPlotOptions;
import org.moxieapps.gwt.highcharts.client.plotOptions.Marker;
import org.moxieapps.gwt.highcharts.client.plotOptions.PlotOptions.Stacking;

import com.google.gwt.core.client.EntryPoint;
import com.google.gwt.i18n.client.NumberFormat;
import com.google.gwt.user.client.ui.RootPanel;

public class HelloWorld implements EntryPoint {
   public void onModuleLoad() {
      Chart chart = new Chart()
         .setType(Type.AREA)
         .setChartTitleText("Fruit consumption *")
         .setChartSubtitle(new ChartSubtitle()
            .setText("* Jane's banana consumption is unknown")
            .setFloating(true)
            .setAlign(Align.RIGHT)
            .setVerticalAlign(VerticalAlign.BOTTOM)
            .setY(15)
         )
         .setSpacingBottom(30)
         .setLegend(new Legend()
            .setLayout(Legend.Layout.VERTICAL)
            .setAlign(Legend.Align.LEFT)
            .setVerticalAlign(Legend.VerticalAlign.TOP)
            .setX(150)
            .setY(100)
            .setFloating(true)
            .setBorderWidth(1)
            .setBackgroundColor("#FFFFFF")
         )
         .setToolTip(new ToolTip()
            .setFormatter(
               new ToolTipFormatter() {
                  public String format(ToolTipData toolTipData) {
                     return "<b>" + toolTipData.getSeriesName() + "</b<<br/>" +
	                     toolTipData.getXAsString() + ": " + toolTipData.getYAsLong();
                  }
               }
            )
         )
         .setCredits(new Credits()
            .setEnabled(false)
         )
         .setAreaPlotOptions(new AreaPlotOptions()
            .setFillOpacity(0.5)
      );

      chart.getXAxis()
         .setCategories(
            "Apples", "Pears", "Oranges", "Bananas", "Grapes", "Plums", "Strawberries", "Raspberries"
         );

      chart.getYAxis()
         .setAxisTitleText("Y-Axis")
         .setLabels(new YAxisLabels()
         .setFormatter(new AxisLabelsFormatter() {
            public String format(AxisLabelsData axisLabelsData) {
               return String.valueOf(axisLabelsData.getValueAsLong());
            }
         })
      );

      chart.addSeries(chart.createSeries()
         .setName("John")
         .setPoints(new Number[] {0, 1, 4, 4, 5, 2, 3, 7})
      );
      chart.addSeries(chart.createSeries()
         .setName("Jane")
         .setPoints(new Number[] {1, 0, 3, null, 3, 1, 2, 1})
      );
      RootPanel.get().add(chart);
   }
}
Result
Verify the result.
gwt_highcharts_area_charts.htm
Advertisements