- Chart.js Tutorial
- Chart.js - Home
- Chart.js - Introduction
- Chart.js - Installation
- Chart.js - Syntax
- Chart.js - Basics
- Chart.js - Color
- Chart.js - Options
- Chart.js - Interactions
- Chart.js - Legend
- Chart.js - Title
- Chart.js - Animation
- Chart.js - Tooltip
- Chart.js - Line Chart
- Chart.js - Bar Chart
- Chart.js - Radar Chart
- Chart.js - Doughnut Chart
- Chart.js - Pie Chart
- Chart.js - Polar Area Chart
- Chart.js - Bubble Chart
- Chart.js - Scatter Chart
- Chart.js - Mixed Chart
- Chart.js - Cartesian Axis
- Chart.js - Category Axis
- Chart.js - Radial Axis
- Chart.js Useful Resources
- Chart.js - Quick Guide
- Chart.js - Useful Resources
- Chart.js - Discussion
Chart.js - Color
Chart.js library provides us various format with the help of which we can easily supply the colors to the chart or graph options. You can specify the color as string in the following notations −
- Hexadecimal
- RGB
- HSL
Chart.js will use the global default color, if you haven’t specified any color and if the chart needed color. The following table provides the 3 color options that are stored in "Chart.defaults" −
| Name | Type | Default | Description |
|---|---|---|---|
| backgroundColor | Color | rgba(0, 0, 0, 0.1) | Background color |
| borderColor | Color | rgba(0, 0, 0, 0.1) | Border color |
| Color | Color | #666 | Font color |
Example
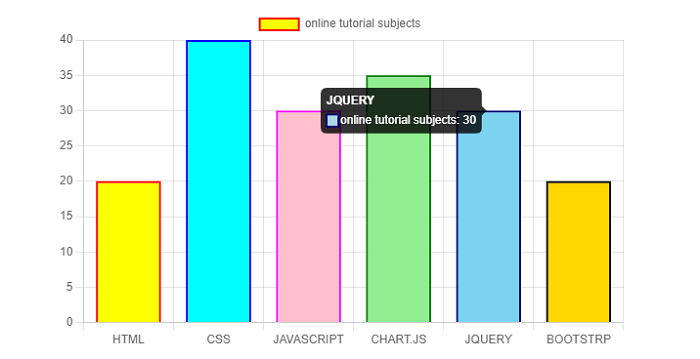
Let’s take an example in which we will set the color in our chart −
<!DOCTYPE>
<html>
<head>
   <meta charset- "UTF-8" />
   <meta name="viewport" content="width=device-width, initial-scale=1" />
   <title>chart.js</title>
</head>
<body>
   <canvas id="chartId" aria-label="chart" height="350" width="580"></canvas>
   <script src="https://cdnjs.cloudflare.com/ajax/libs/Chart.js/3.1.1/chart.min.js"></script>
   <script>
      var chrt = document.getElementById("chartId").getContext("2d");
      var chartId = new Chart(chrt, {
         type: 'bar',
         data: {
            labels: ["HTML", "CSS", "JAVASCRIPT", "CHART.JS", "JQUERY", "BOOTSTRP"],
            datasets: [{
               label: "online tutorial subjects",
               data: [20, 40, 30, 35, 30, 20],
               backgroundColor: ['yellow', 'aqua', 'pink', 'lightgreen', 'lightblue', 'gold'],
               borderColor: ['red', 'blue', 'fuchsia', 'green', 'navy', 'black'],
               borderWidth: 2,
            }],
         },
         options: {
            responsive: false,
         },
      });
   </script>
</body>
</html>
Output
This HTML code will produce the following chart having graph elements with different colors −
Advertisements